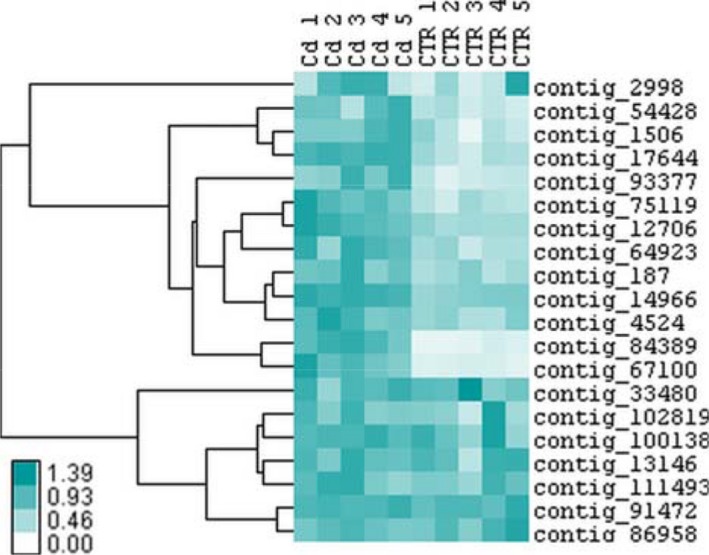
Figure 4.

Heat map representation of gene expression data from five biological replicates showing the hierarchical clustering (Pearson uncentred, complete linkage clustering) of cell wall‐related genes in M. sativa stems under long‐term Cd exposure (10 mg·kg−1 soil). Colour intensity is proportional to the actual expression value. Values are provided in Appendix S7.
