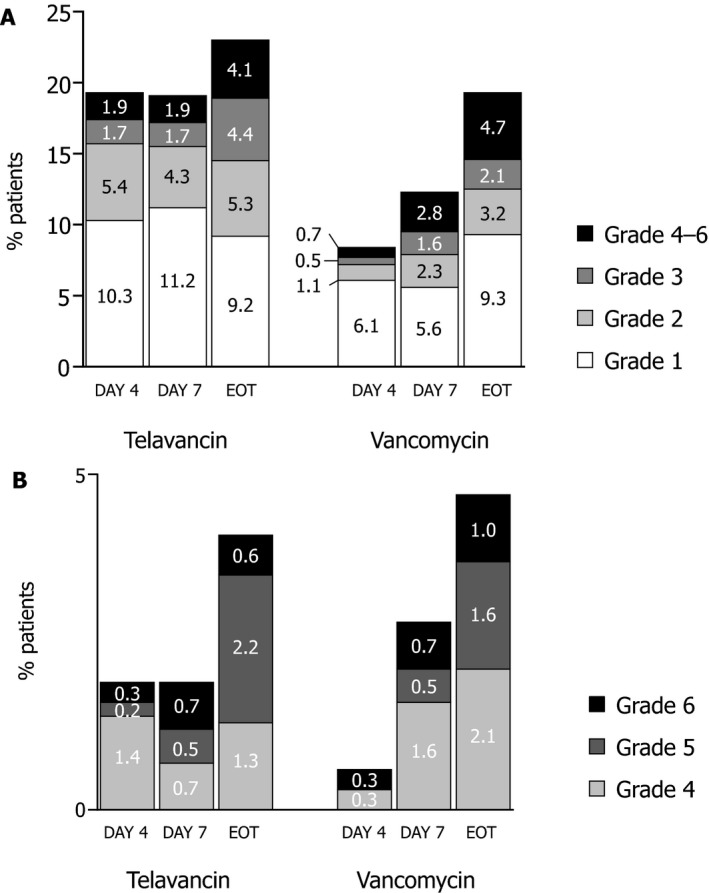
Figure 1.

Distribution of the negative shifts in renal function by grade in the telavancin and vancomycin groups. The proportions of patients who experienced a negative shift of grades 1–6 on days 4 and 7 after the initial dose of telavancin or vancomycin and at the end of therapy (EOT) are shown in panel A. The breakdowns of the larger negative shifts in renal function (grades 4–6) are shown in panel B.
