
Figure 2.
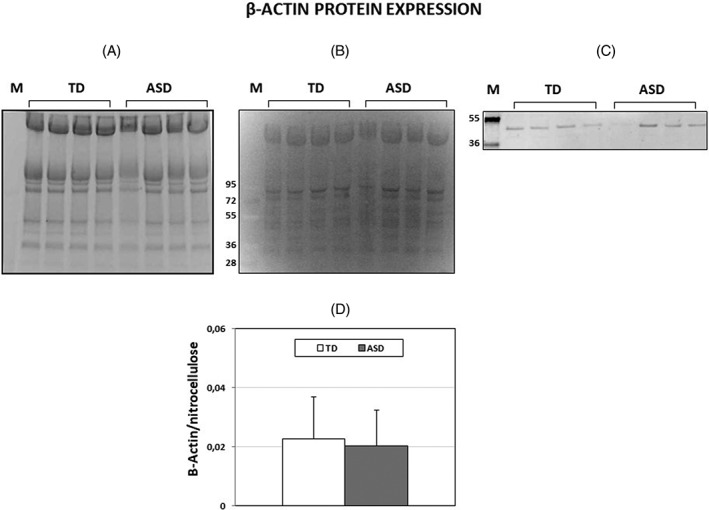
Beta‐actin protein expression in erythrocytes from TD and ASD children. A: A representative SDS‐Gel electrophoresis of ghost samples. Precast Mini‐PROTEAN TGX stain‐free protein gel, 4–15% polyacrylamide gels were used. B: Nitrocellulose membrane blotted from the gel of Figure 2A. The fluorescence produced under UV light by trihalo compounds is proportional to the total protein. Samples from TD erythrocytes were run in lanes 1–4, samples from ASD erythrocytes were run in lanes 5–8. Lane M: M.W. markers. C: Beta‐actin bands developed from the membrane by an anti‐actin antibody marked with Cy5 (see Supporting Information of Table S2). D: Histogram showing means ± SD. of β‐actin/total lane fluorescence ratio.