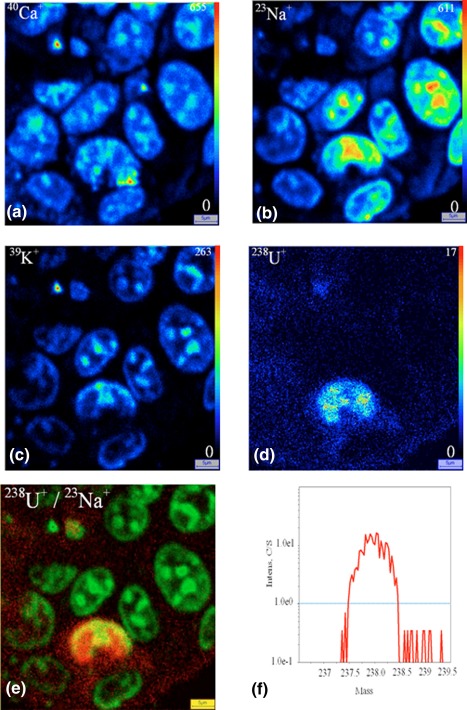
Figure 4.

Uranium distribution inside the HepG2 cells exposure to 50 μM of uranyl nitrate for 30 min, cryopreparation, SIMS ionic images (a) 40Ca+, (b) 23Na+, (c) 39K+, (d) 238U+, (e) superposition of 238U+(red)/23Na+(green), (f) 238U+ mass spectrum. Field 50 × 50 μm2 [Color figure can be viewed at http://wileyonlinelibrary.com]
