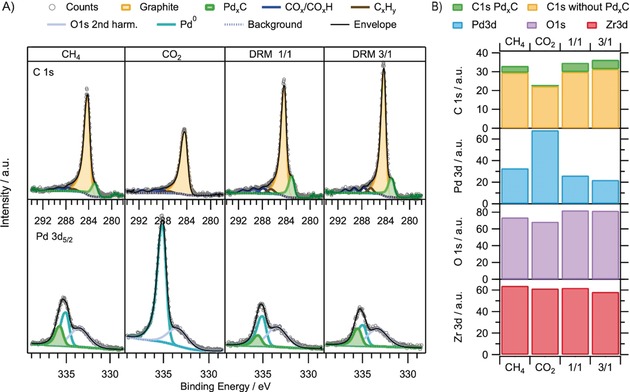
Figure 3.

C 1s and Pd 3d5/2 AP‐XPS spectra recorded at a common kinetic energy of 400 eV in situ during DRM at ca. 700 °C, starting from the bulk PdxZry precursor. Applied gas pressures from left to right: 0.3 mbar CH4, 0.3 mbar CO2, DRM 1:1=0.15 mbar CH4+0.15 mbar CO2, DRM 3:1=0.225 mbar CH4+0.125 mbar CO2. A) Corresponding C 1s and Pd 3d5/2 peak deconvolution; B) XPS intensity bar graph of the integrated C 1s, Pd 3d, O 1s, and Zr 3d regions.
