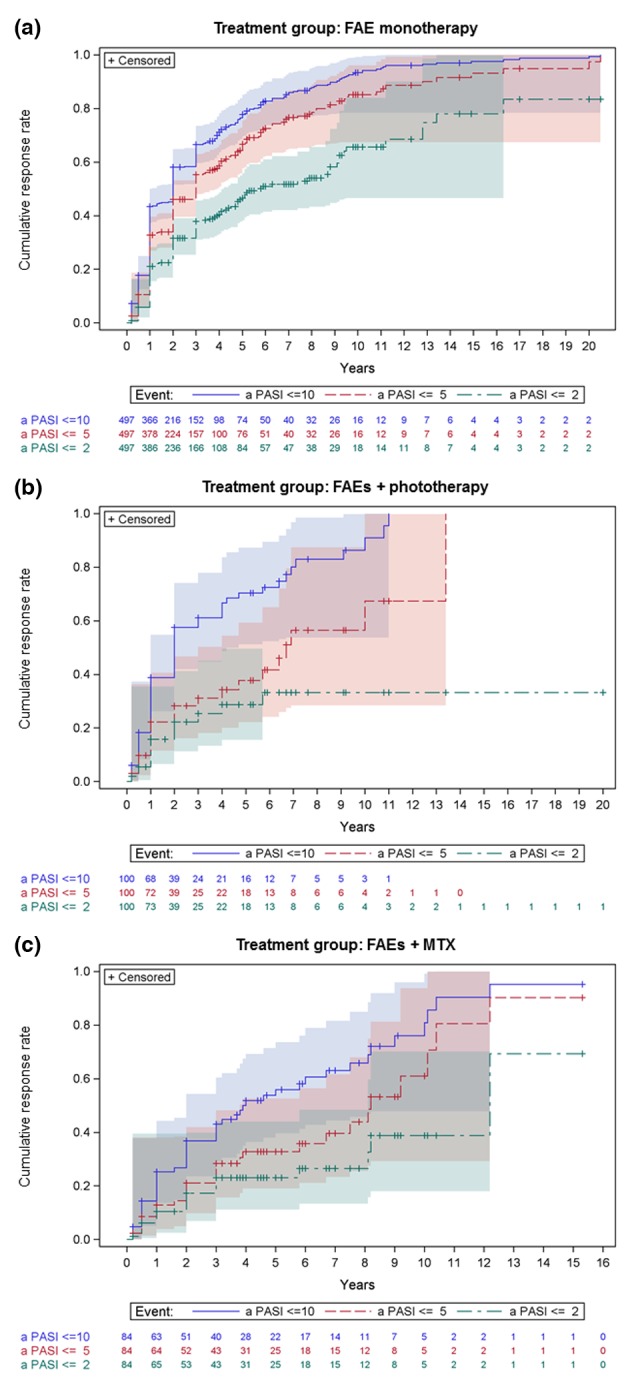
Figure 3.

Cumulative improvement in absolute PASI response (events: aPASI ≤ 10, aPASI ≤ 5 and aPASI ≤ 2) by treatment group: (a) FAE monotherapy, (b) FAEs + phototherapy and (c) FAEs + MTX. Kaplan–Meier failure curves with the number of patients ‘at risk’ (on therapy) in each group and 95% Hall–Wellner bands.
