
Figure 4.
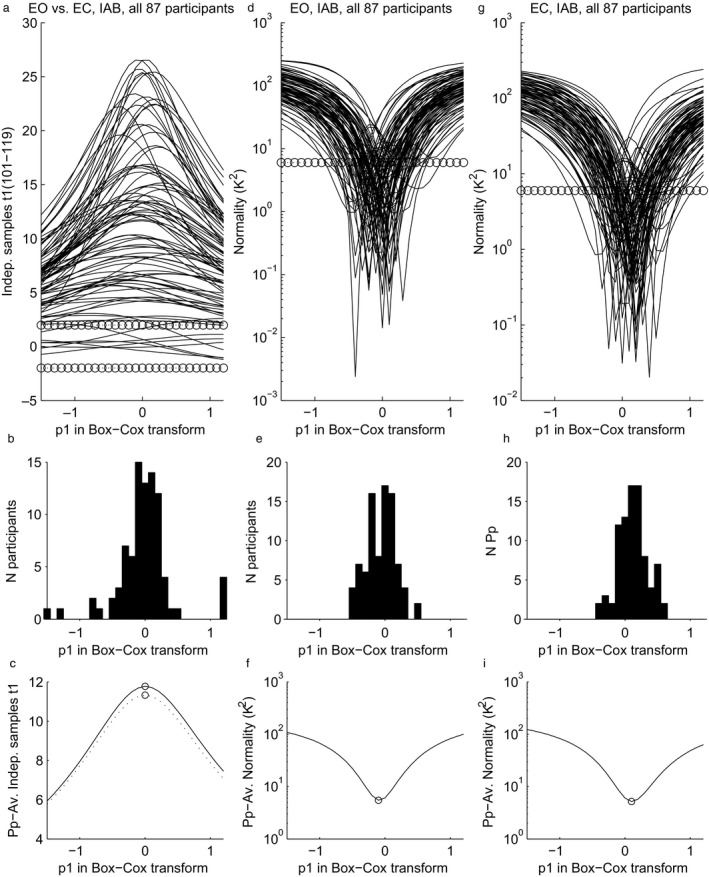
Effects of p1 in transformations of power in the individual alpha band at the single‐epoch level (Eqn (2)) on analyses at participant level (level 1, see text). (a) Statistical power (t1‐value) of the contrast between eyes‐open and eyes‐closed, for all participants. (b) Histogram of the peaks of the waveforms depicted in panel a. (c) Solid line: average across participants of the waveforms depicted in panel a, so for the individual alpha band. Dotted line: the same, but now for the generic alpha band (not plotted in panel a and b). (d) Normality (K 2) of the distribution across epochs in the eyes‐open condition, for all participants. Lower values indicate a closer approximation to normal. (e) Histogram of the troughs depicted in panel d. (f) Average across participants of the waveforms depicted in panel d. (g) Normality (K 2) of the distribution across epochs in the eyes‐closed condition, for all participants (lower is more normal). (h) Histogram of the troughs depicted in panel g. (i) Average across participants of the waveforms depicted in panel g. The number of non‐artefactual epochs varied among participants; therefore, degrees of freedom for the t‐tests ranged from 101 to 119. Circles mark critical t1 values for Df = 100 at alpha = 0.05 (two‐sided) in panel (a), and critical K 2 values at alpha = 0.05 (two‐sided) in panels (d) and (g).