
Figure 7.
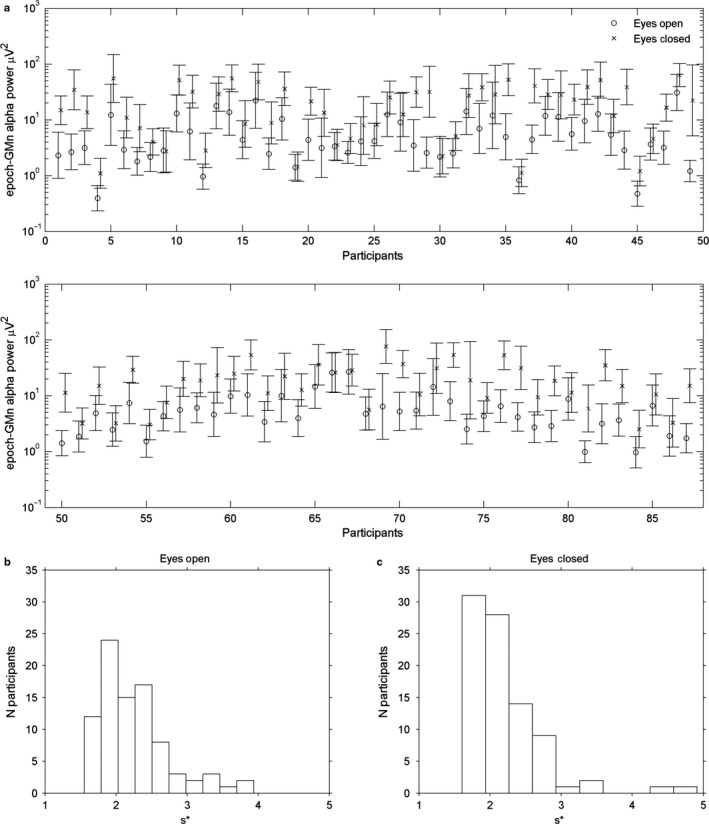
(a) Geometric mean alpha power in the individual alpha band for all 87 participants, plotted on a log scale. Error bars indicate the multiplicative standard deviation s* (see text). For clarity, the data for the eyes‐closed condition have been slightly moved to the right. (b) The distribution of the multiplicative standard deviation s* among participants in the eyes‐open condition. (c) The same as (b), but in the eyes‐closed condition.