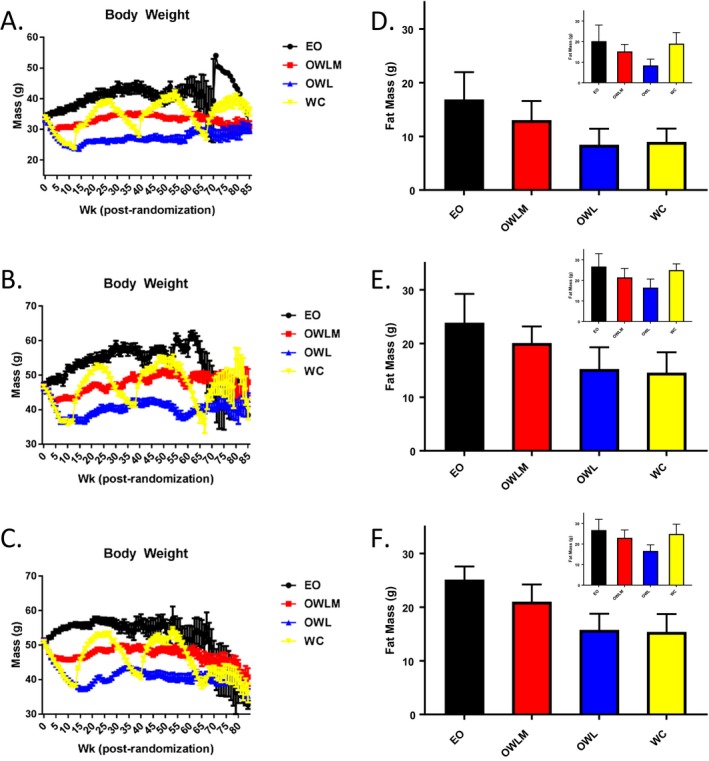
Figure 1.

Body weight and body composition. Weekly body weight after randomization (mean ± SE) by group, including (A) wave 1 female, (B) wave 1 male, and (C) wave 2 male (all waves and sexes P < 0.01 [OWL, OWLM, and WC] vs. EO in postrandomization weeks 12‐50). A small sample (n = 15/sex) of low‐fat‐fed mice were used as a “benchmark” for the OWL body weight target (see Supporting Information Table S10. Body fat mass as measured by quantitative magnetic resonance (mean ± SD) following initial weight loss (T1, ~week 13; P < 0.01 all groups vs. EO) and regain by the WC group (T2, ~week 29; EO vs. WC, P not significant). (D) wave 1 female; (E) wave 1 male; (F) wave 2 male. EO, Ever Obese (black); OWLM, Obese Weight Loss Moderate (red); OWL, Obese Weight Loss (blue); QMR, Quantitive Magnetic Resonance; WC, Weight Cyclers (yellow).
