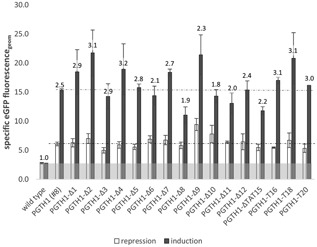
Figure 4.

Screening data of the PGTH1 deletion and TAT15 mutation variants. The geometric means of the populations’ specific eGFP fluorescence (fluorescence related to cell volume) are shown for clones expressing eGFP under the control of PGTH1 (clone #8, verified GCN of one) or a PGTH1 variant (up to nine clones were pool cultivated in three wells) in repressing and inducing growth conditions. The numbers above the bars represent the fold‐change of induction versus repression. Wild‐type P. pastoris cells were used as negative control. eGFP: enhanced green fluorescent protein; GCN: gene copy number
