
Figure 1.
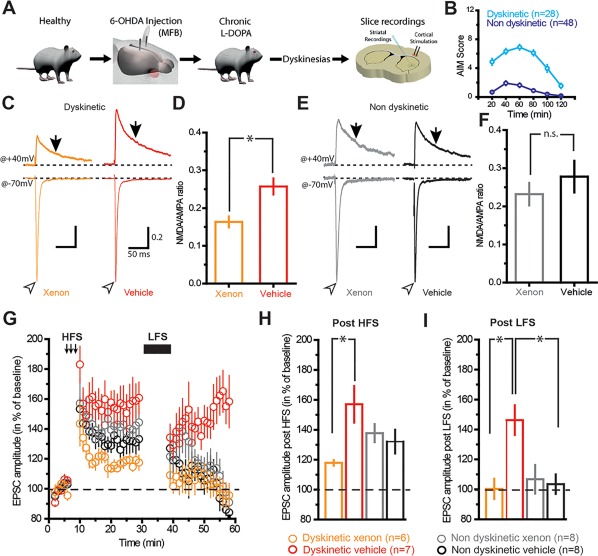
Corticostriatal plasticity in SPN is selectively restored by xenon exposure in dyskinetic mice. (A) Scheme depicting the experimental procedures for ex vivo electrophysiology. (B) Graph depicting abnormal voluntary movements (AIM) scored over a period of 2 hours in dyskinetic and nondyskinetic mice. (C) Sample traces of synaptic EPSC NMDA/AMPA ratios (determined by electrical stimulation of corticostriatal axons) recorded from SPNs in brain slices exposed for 1 hour to xenon or vehicle gas. Traces are normalized to the peak of AMPA currents. (D) Population data indicating the reduction of NMDA/AMPA ratio in SPN exposed to xenon. Open arrowheads and arrows indicate where AMPA and NMDA current amplitudes were measured, respectively (ratio xenon, 0.163 ± 0.014; n = 30 neurons; ratio vehicle, 0.257 ± 0.021; n = 34). (E, F) Same as C and D but in nondyskinetic mice. Note the absence of change in NMDA/AMPA ratios (ratio xenon, 0.231 ± 0.029; n = 15 neurons; ratio vehicle, 0.277 ± 0.041; n = 16 neurons). Stimulus artifacts have been deleted from sample traces for clarity. Scales in E are the same as C. *P < 0.05, unpaired t test. (G) Representative time course of peak EPSCs recorded in SPN before (left), after high‐frequency stimulation (middle), and after low‐frequency stimulation (right: post‐LFS) obtained from brain slices of dyskinetic mice exposed to xenon (orange trace) or vehicle gas (red trace) and from brain slices of nondyskinetic mice exposed to xenon (gray trace) or vehicle gas (black trace). (H) Bar graph shows that xenon reduces the magnitude of corticostriatal LTP compared with vehicle gas in dyskinetic mice (dyskinetic xenon, 117.9% ± 1.86%; n = 6 neurons; dyskinetic vehicle, 157% ± 12.25%; n = 7 neurons; nondyskinetic xenon, 140.77% ± 7.31%; n = 8 neurons; nondyskinetic vehicle, 132.11% ± 7.92%; n = 8 neurons; F 1,25 = 7.894, P = 0.0095, 2‐way ANOVA). (I) Bar graph showing that xenon selectively restores corticostriatal depotentiation compared with vehicle gas in dyskinetic mice (dyskinetic xenon, 100.28% ± 6.74%; n = 6 neurons; dyskinetic vehicle, 146.24% ± 9.95%, n = 7 neurons; nondyskinetic xenon, 106.75% ± 9.56%; n = 8 neurons; nondyskinetic vehicle, 103.46% ± 6.49%; n = 8 neurons; F 1,25 = 8.326; P = 0.0079, 2‐way ANOVA). *P < 0.05, 2‐way ANOVA, Bonferroni post hoc test. B, D, F‐I, values shown as mean ± standard error. [Color figure can be viewed at http://wileyonlinelibrary.com]