
Figure 6.
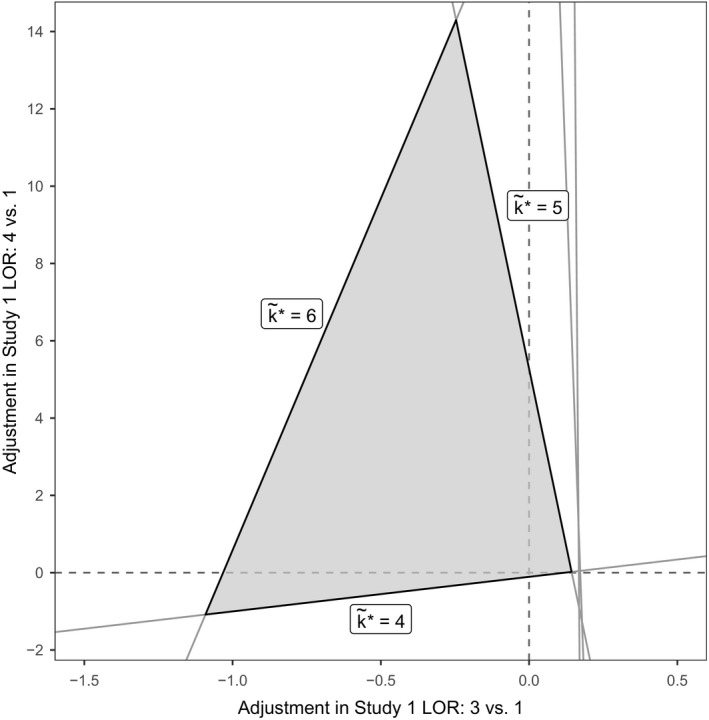
Invariant region formed from threshold lines for bias adjustment to the two relative effect estimates from study 1 ( , invariant region): the new optimal treatments on the boundary are indicated by ; optimal treatment without bias adjustment is k
*=3
, invariant region): the new optimal treatments on the boundary are indicated by ; optimal treatment without bias adjustment is k
*=3