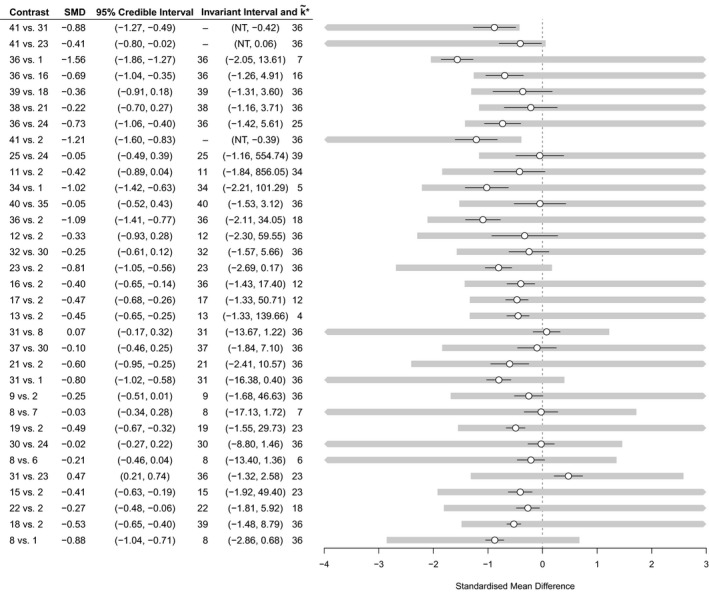
Figure 8.

Contrast level forest plot for the social anxiety example showing results of the threshold analysis, sorted with smallest thresholds first (only contrasts with a threshold less than 2 SMDs are shown here for brevity; the complete results can be found in the Web supplementary material; the optimal treatment without bias adjustment is k*=41); NT, no threshold; ∘, SMD; —, 95% credible interval;  , invariant interval
