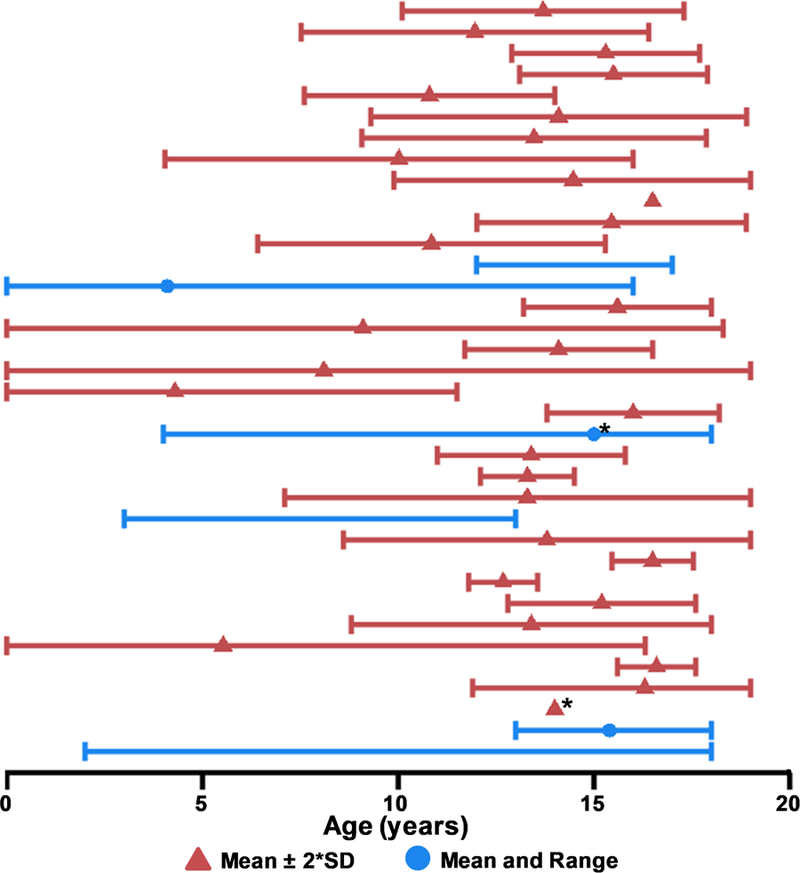
Figure 4: Patient Age Across Studies.

The mean age (triangle) and either two times the standard deviation (SD; red) or age range (minimum to maximum; blue) of included patients with pediatric mild traumatic brain injury (pmTBI) are presented in Figure 4. Asterisks (*) denote studies reporting the median rather than mean as a measure of central tendency. Studies which did not report an explicit age statistic are not graphed, and those that did not list SD or range are depicted by a single point. All SDs were artificially capped at 0 and 19 for data display purposes as studies exceeding these bounds were not considered for review. Only data from unique or primary studies (N=36) are presented in Figure 4.
