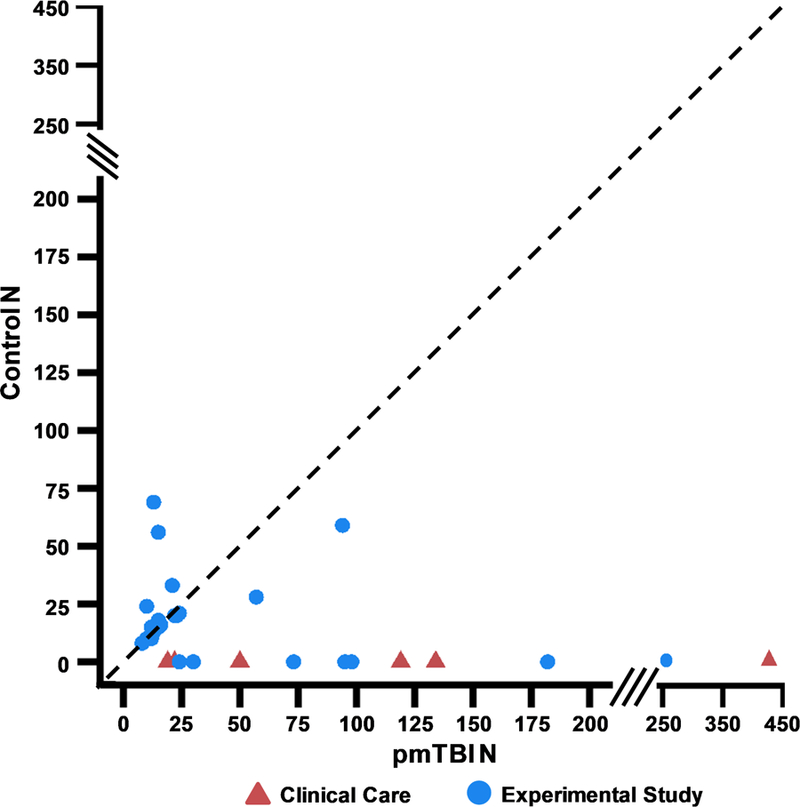
Figure 6: Sample Sizes.

Figure 6 plots the number (N) of patients with pediatric mild traumatic brain injury (pmTBI; X-axis) relative to the number of controls (Y-axis) utilized in the unique and primary studies (N=36). Only the number of participants who were characterized with biomarker data are plotted for studies that obtained clinical data on larger cohorts. To represent the data with higher fidelity, the X and Y axes are both split (see solid slanted lines) between N=0–200 (interval=25) and N=250–450 (interval=100) range. Red triangles indicate that the study was conducted as part of clinical care whereas blue circles indicate that the study design was experimental in nature. The dashed line represents an ideal study design in which equal numbers of pmTBI and controls are included. The majority of studies exhibit a rightward deviation from the dashed line, which was much more pronounced for clinical care studies and suggests increased risk of bias.
