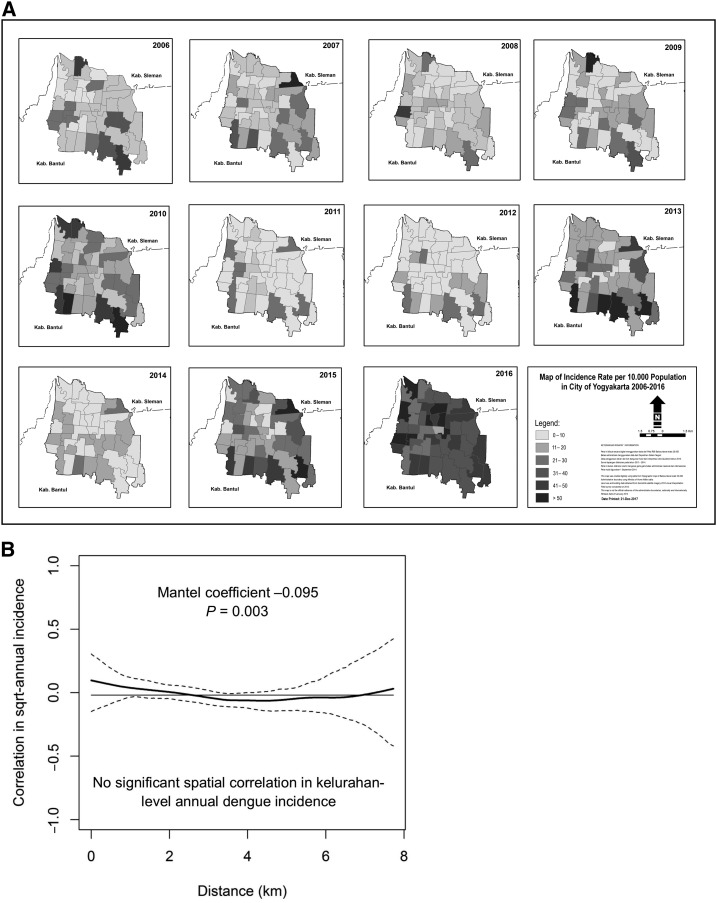
Figure 3.
(A) Map of 45 administrative areas (kelurahans) in Yogyakarta city, shaded by annual dengue incidence (per 100,000 population) for each year, 2006–2016. (B) Nonparametric correlation function shows pairwise correlation (solid line) between 45 kelurahans in Yogyakarta city in their annual dengue incidence (square root transformed and standardized to zero mean and standard deviation of one), as a function of the distance between the centroids of kelurahans. Dashed lines represent 95% confidence intervals, and the horizontal line is the overall correlation in kelurahan-level annual dengue incidence across Yogyakarta city. The Mantel test coefficient reports average spatial dependence in annual dengue incidence over all pairwise inter-kelurahan distances.

