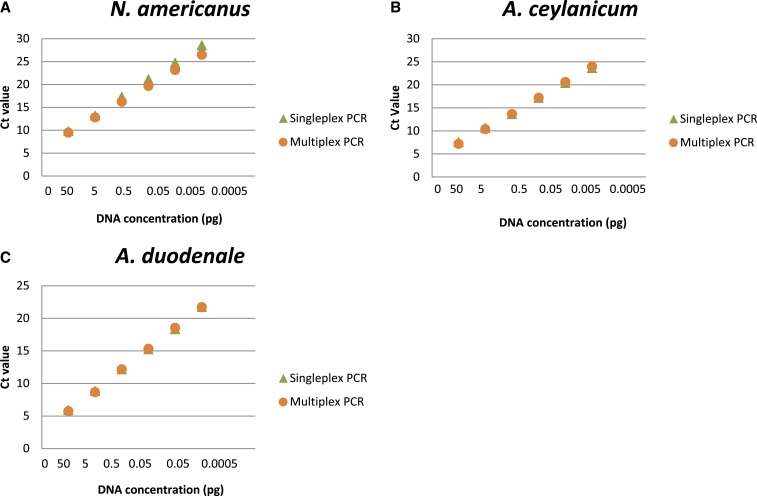
Figure 1.
Singleplex and multiplex qPCR efficiencies. Assay optimization to compare the efficiencies of single vs. multiplex PCR assays using gBlock gene targets for (A) Necator americanus, (B) Ancylostoma ceylanicum, and (C) Ancylostoma duodenale fragments (IDT® Technologies) as standard curve controls. Ct = cycle threshold. This figure appears in color at www.ajtmh.org.

