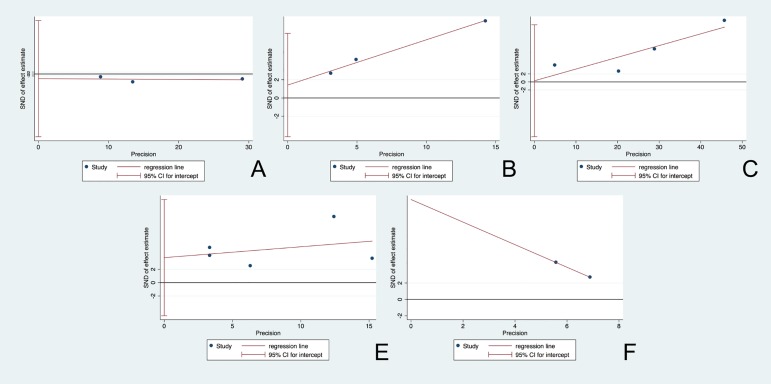
Fig 2. Funnel plot for the assessment of potential publication bias.
The funnel graphs plot the square root of the effective sample size (1/ESS1/2) against the OR. Each dot represents each study in the meta-analysis. Asymmetry of the dot distribution between regression lines indicates potential publication bias. (A) for the evaluation of average level of mtDNA copy number, (B) for the risk analysis among the group below median mtDNA copy number level, (C) for the evaluation of risk increase by every 1-SD decrease in mtDNA copy number level, (D) for the risk measurement of the population located in the lowest part of quartile division of mtDNA copy number level, and (E) for the association analysis between mtDNA copy number and the risk of SCD. This funnel plot indicates no publication bias with a p value >0.05. OR = odds ratio, ESS = effective sample size.

