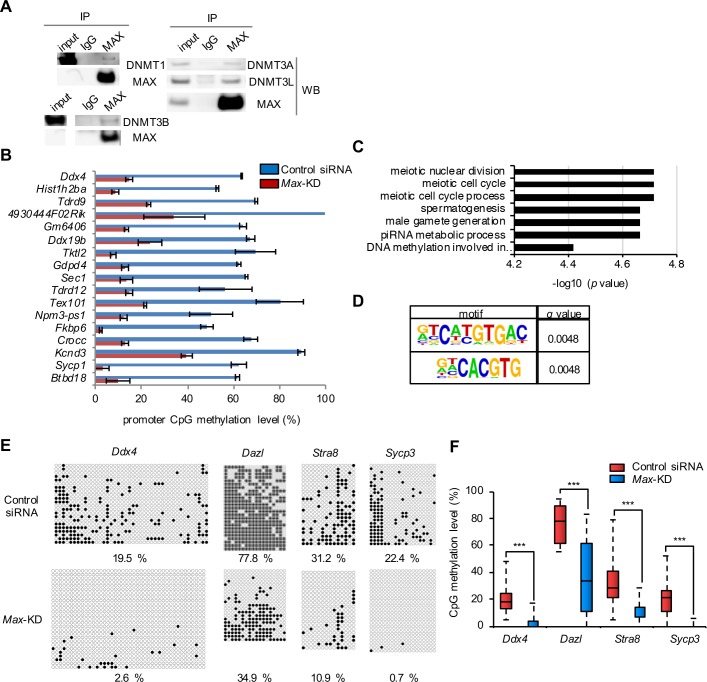
Fig 2. MAX-mediated repression of germ cell–related genes through DNA methylation.
(A) Samples immunoprecipitated using anti-MAX antibody or control IgG were analyzed by Western blotting using anti-DNMT antibodies. Principally, the same result was obtained in two independent experiments. The un-cropped data of these images are shown in S4A Fig. (B) Levels of CpG methylation of genes with a DMR in close proximity (±300 bp) for Max-KD ESCs and control ESCs from TMS. The ratios of methylated CpGs in the regions ±300 bp of the genes are shown. Values are plotted as mean ± SEM of 2 biological replicates. (C) GO analysis of 17 genes with DMRs hypomethylated in Max-KD ESCs compared with control ESCs. GO terms with corrected P value < 0.05 (top 7) are shown. (D) Motif analyses of 17 DMRs showed significant enrichment of E-box–like sequences. Motif sequences with the lowest q value (top 2) are shown. (E) DNA methylation status of the promoter regions of the late PGC markers in control and Max-KD ESCs, as determined by bisulfite sequencing. The filled and open circles indicate methylated- and un-methylated CpGs, respectively. The data shown were combined from two independent experiments. The percentage of methylated CpGs is indicated. (F) Box-whisker plots of the CpG methylation levels shown in Fig 2E. The lines inside the boxes show the median. The whiskers indicate the minimum and maximum. ***P < 0.001 (Mann-Whitney U-test).

