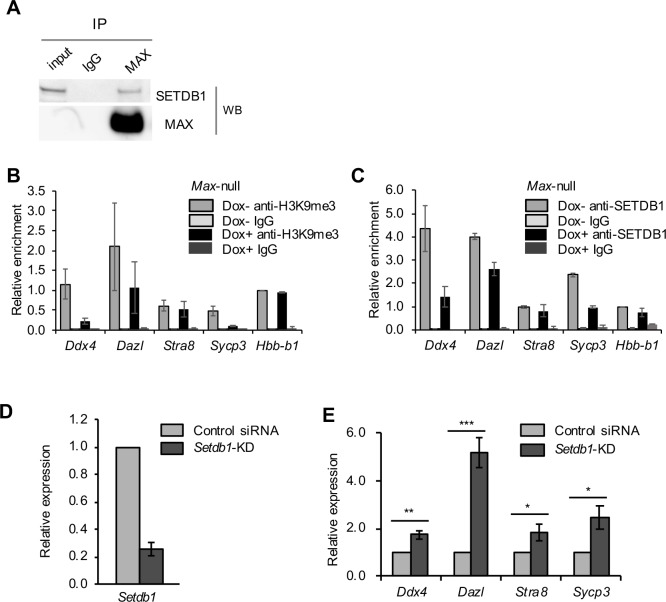
Fig 3. MAX-mediated repression of germ cell–related genes through H3K9me3.
(A) Samples immunoprecipitated using anti-MAX antibody or control IgG were analyzed by Western blotting using anti-SETDB1 antibody. Principally, the same result was obtained in two independent experiments. The un-cropped data of this image is shown in S5B Fig. (B, C) ChIP-qPCR analyses of Max-null ESCs (Dox+) and control ESCs (Dox−) using anti-H3K9me3 antibody (B), anti-SETDB1 antibody (C) or control IgG. The data are displayed in the same way as in Fig 1A. (D) KD efficiency of Setdb1 in ESCs at day 2 post-siRNA treatment, as determined by RT-qPCR. (E) Relative expression of the late PGC markers in Setdb1-KD ESCs, as determined by qRT-PCR. The expression in control ESCs was set as 1.0. Values are plotted as the mean ± SEM of 3 biological replicates. *P < 0.05, **P < 0.01, ***P < 0.001 (Student’s t-test).

