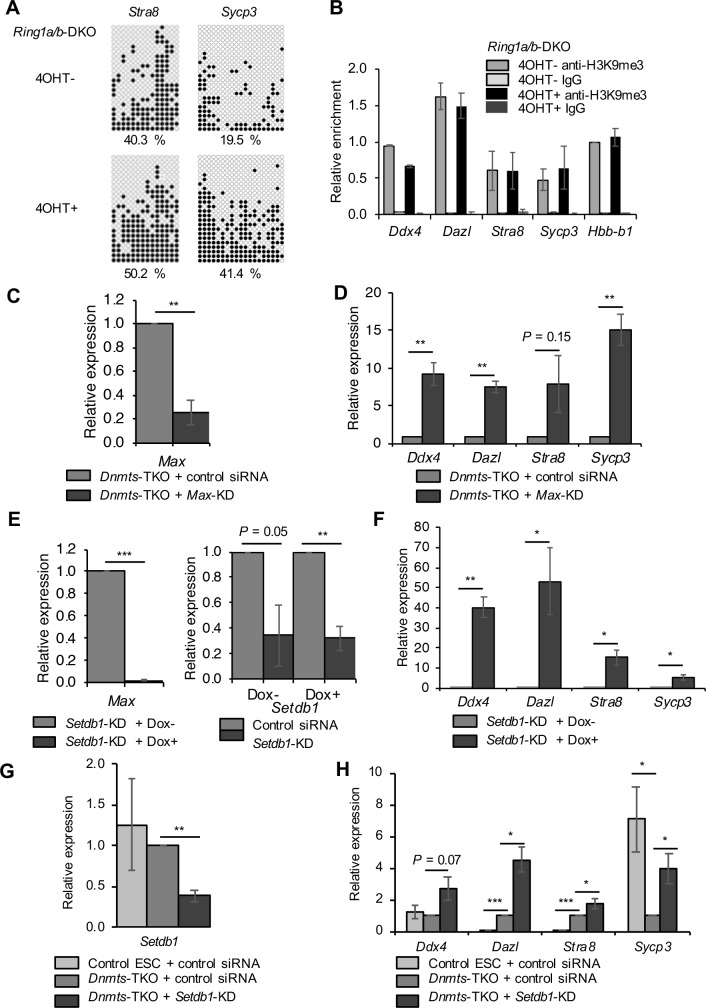
Fig 4. RING1A/B-independent DNA and H3K9 methylation, and a cooperative effect of Dnmts-TKO and Setdb1-KD on repression of the late PGC markers.
(A) DNA methylation status of the promoter regions of Stra8 and Sycp3 in control (4OHT−) and Ring1a/b-DKO ESCs (4OHT+) determined by bisulfite sequencing. The data are displayed in the same way as in Fig 2E. (B) ChIP-qPCR analyses of Ring1a/b-DKO ESCs (4OHT+) and control ESCs (4OHT−) using anti-H3K9me3 antibody or control IgG. The data are displayed in the same way as in Fig 1A. (C) KD efficiency of Max in Dnmts-TKO ESCs at day 3 post-siRNA treatment, as determined by RT-qPCR. (D) Relative expression of the late PGC markers in Max-KD/Dnmts-TKO ESCs, as determined by qRT-PCR. The expression in Dnmts-TKO ESCs with control siRNA treatment was set as 1.0. (E) KO and KD efficiency of Max (left panel) and Setdb1 (right panel) in Setdb1-KD/Max-null ESCs at day 3 post-siRNA treatment, as determined by RT-qPCR. KD efficiency of Setdb1 is normalized with the expression of Setdb1 in Max-null ESCs with control siRNA treatment. (F) Relative expression of the late PGC markers in Setdb1-KD/Max-KO ESCs, as determined by qRT-PCR. The expression in Setdb1-KD ESCs with Max expression (Dox-) was set as 1.0. (G) KD efficiency of Setdb1 in Dnmts-TKO ESCs at day 2 post-siRNA treatment, as determined by RT-qPCR. (H) Relative expression of the late PGC markers in Setdb1-KD/Dnmts-TKO ESCs, as determined by qRT-PCR. The expression in Dnmts-TKO ESCs with control siRNA treatment was set as 1.0. Values are plotted as the mean ± SEM of 3 biological replicates. *P < 0.05, **P < 0.01, ***P < 0.001 (Student’s t-test).

