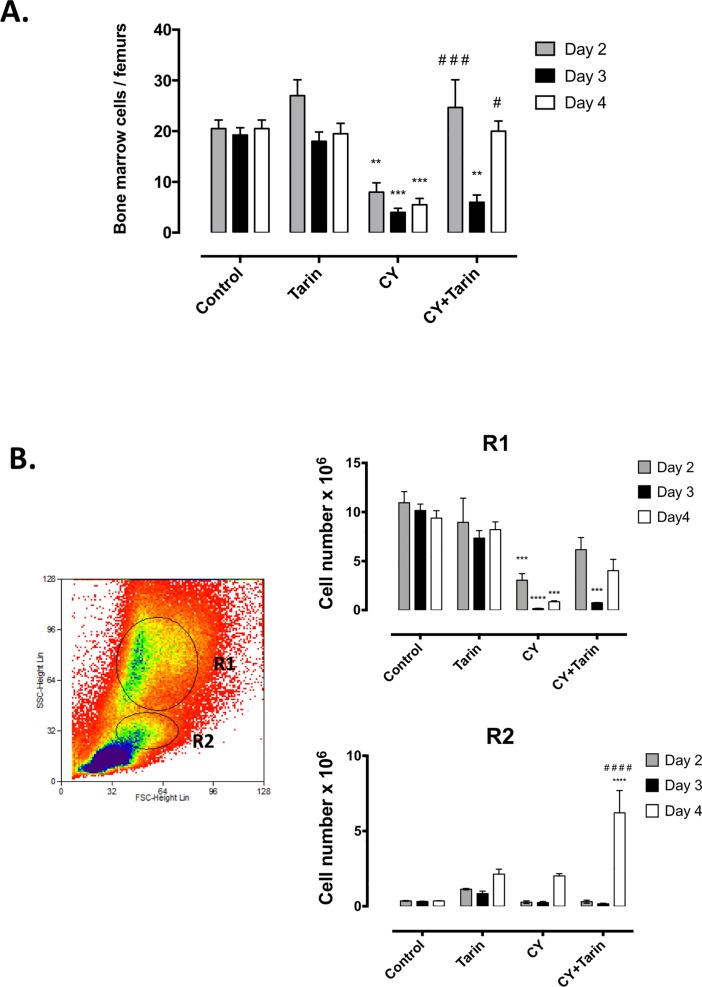
Fig 3. Tarin effects on bone marrow cell numbers.
(A) Total BM cell numbers from: CY- CY-immunosuppressed mice; CY+Tarin—CY- immunosuppressed mice treated with 200 μg tarin; Tarin—mice treated with 200 μg tarin or Control–mice inoculated with saline. Mice BM cells were evaluated after 24h tarin treatment on days 2, 3 or 4. (B) Dot plots on the left-hand panel represent cell distribution profile (size vs granularity) from healthy BM cells by flow cytometry. The R1 region corresponds to granulocytic lineage cells, while R2 corresponds to mononuclear/blastic cells based on cell size and granularity. Right-hand panels show the total number of cells in R1 and R2 from mice BM treated by the aforementioned protocol. ****p<0.0001, ***p<0.001 and ** p<0.01, compared to control. #p<0.05, ###p< 0.001 or ####p< 0.0001 compared to CY group.

