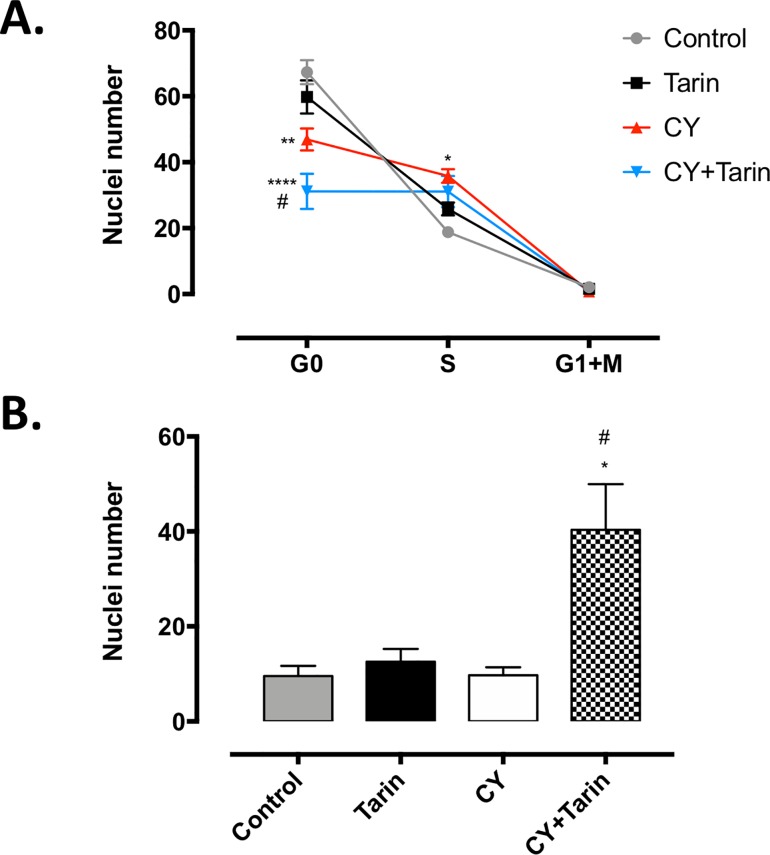
Fig 6. Tarin effects on bone marrow cell proliferation and death.
Cell cycle (A) and apoptosis (B) analyses of BM cells from: CY–CY-immunosuppressed mice; CY+Tarin—CY-immunosuppressed mice treated concomitantly with 200 μg tarin on day 0; Tarin—mice treated with 200 μg tarin on the same day or Control—mice inoculated with saline. BM cells were evaluated by flow cytometry on day 4. *p< 0.05, **p< 0.01 and **** p<0.0001 compared to control group. #p< 0.05 compared to CY group.

