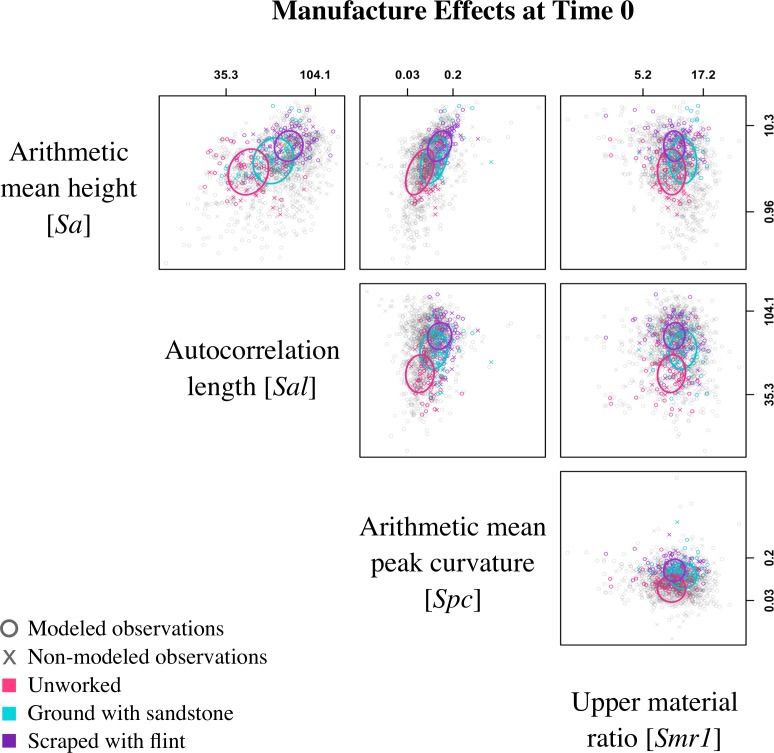
Fig 7. Scatterplot matrix at time 0.
Plot shows all observations (o: modeled points; x: non-modeled points) displayed in the pairwise space of parameters: surface roughness [Sa], autocorrelation length [Sal], peak curvature [Spc], and upper material ratio [Smr1]. Colored observations are representative of Manufacturing state (pink: unworked; turquoise: ground with sandstone; purple: scraped with flint) at time 0 and ellipses show the model predictions of the mean for each pair of parameters using ellipse version 0.3–8 [91]. Axes are on the log scale, but tick labels are in original measurement units and placed at the 5th and 95th percentiles.

