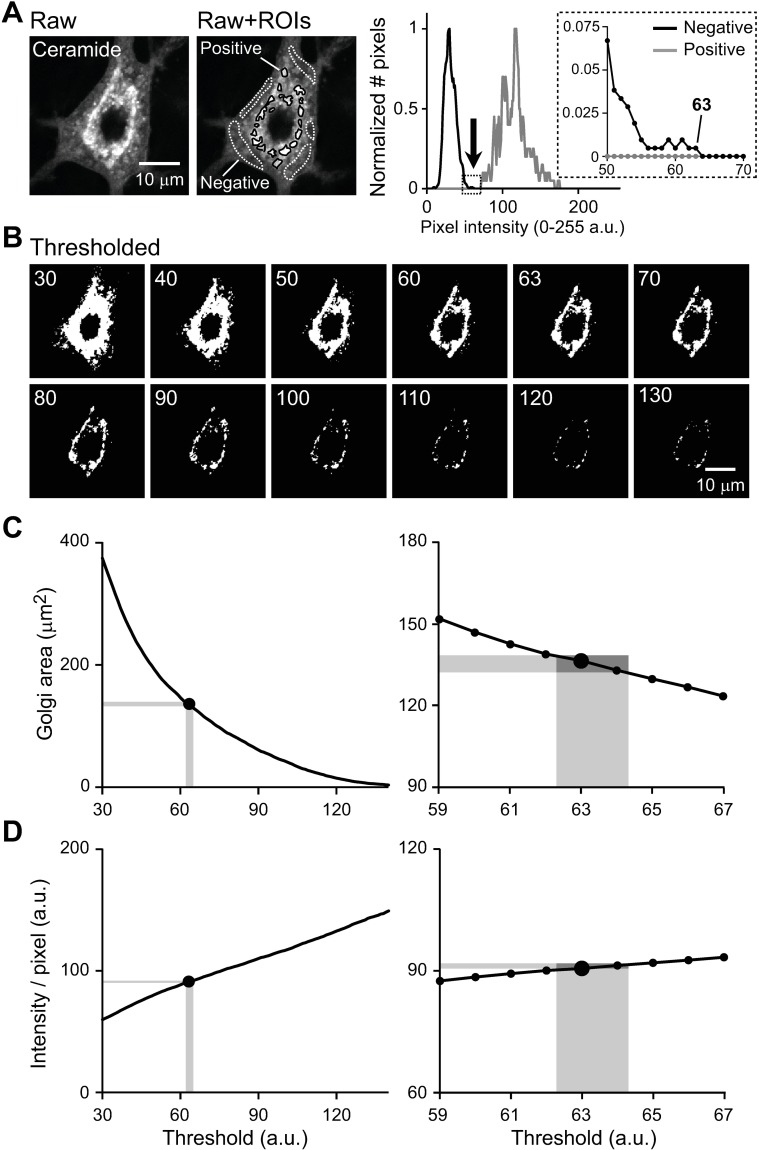
Fig 2. Setting the intensity threshold for quantitative analysis of the ceramide-stained Golgi apparatus.
A single image was obtained as part of a z-stack of images by confocal fluorescence microscopy, from a cultured WT hippocampal neuron at 17 DIV. A: Method for setting the intensity threshold. An image of a single neuron is shown without (left, Raw) and with (middle, Raw+ROIs) manually assigned regions of interest (ROIs). The ROIs were selected within areas representing cytoplasmic background (Negative), as well as within areas with positive staining (Positive). Histogram (right) shows the distribution of the pixel intensity of the negative, background (black) and positive (gray) staining. The arrow points to the maximal pixel intensity of the background, which was used as the threshold value. In each distribution, the Y-axes of the histograms are normalized to the peak incidence. The inset magnifies the boxed part of the main histogram. B: Effects of different threshold values on the area covered by pixels whose intensities are above the threshold. Each panel represents the same image but thresholded at the value indicated. The images are shown in binary format to more clearly illustrate the changes in area (Thresholded). C: Dependence of the measured Golgi area on the threshold values for the same image (left). A magnified section of the graph is also shown (right). D: Plot similar to that in panel C, but showing the dependence of average pixel intensity on threshold values. In B-D, the images and curves represent the data when the threshold was forced to take the indicated values. In C,D, vertical and horizontal gray zones show the standard deviations (SDs) of the thresholds, and the corresponding areas and average pixel intensities, when the threshold value was measured repeatedly using the method illustrated in panel A (maximal intensity of background).

