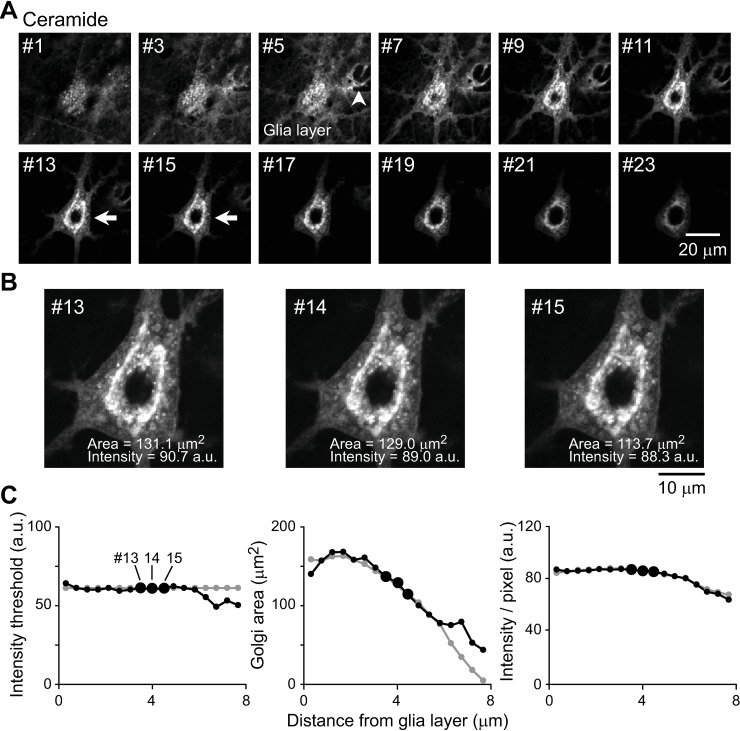
Fig 3. Selecting images in a z-stack for quantitative analysis of the ceramide-stained Golgi apparatus.
All images were obtained by confocal microscopy. A: Multiple images in a z-stack of the neuron imaged in Fig 2. Arrowhead indicates the level of maximal glial signal. Arrows indicate the optimal levels of neuronal signal. Individual images in a z-stack were acquired at 0.44-μm intervals; distance between the panels is 0.44 × 2 = 0.88 μm. B: Magnified views of images #13–15 in A. The measured Golgi areas and intensities are indicated. C: Measured intensity threshold, Golgi area and average pixel intensity of the images shown in panel A. These values depend on the distance from bottom of glial layer. Small black dots indicate the values measured when the intensity threshold was determined for each image. Large black dots indicate the values for images #13–15, which were ultimately used to report Golgi parameters. For comparison, the gray dots indicate the values measured when the intensity threshold was fixed at 63, the value determined for image #14.

