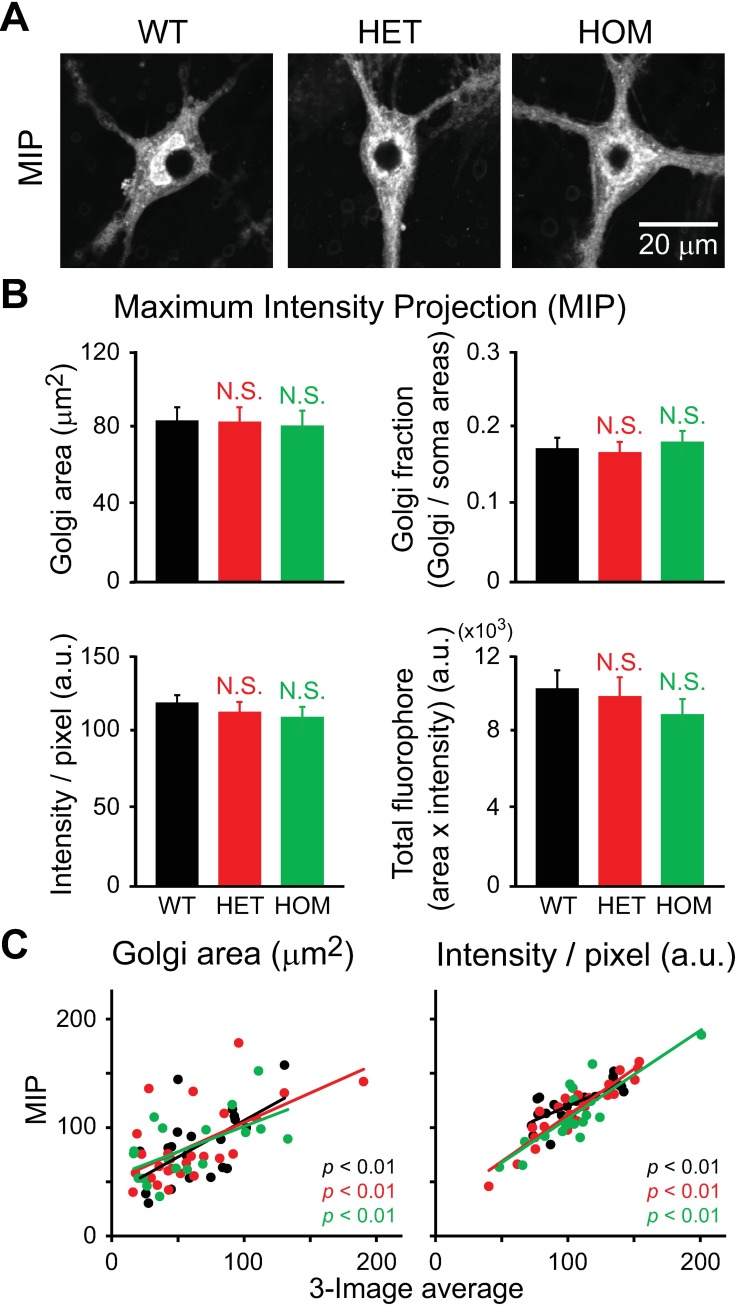
Fig 5. Structure of the Golgi apparatus in the hippocampal neurons of ΔE-torsinA knock-in mice, as analyzed using the maximum intensity projection (MIP) method.
Confocal fluorescence microscopy of cultured neurons at 17–19 DIV. A: Representative images of the WT, HET and HOM neurons shown in Fig 4B, stained with BODIPY FL C5-ceramide and but shown after MIP. B: Quantitative analysis of indicated parameters. Columns represent the mean and the bars represent the SEM. Differences in values measured for mutant vs. WT neurons were not statistically significant (p>0.1; t-test; n = 20, 26, 18 neurons for WT, HET and HOM, respectively). C: Positive correlation between results obtained using the 3-image averaging and MIP methods (p<0.01; t-test for Pearson correlation coefficient; same number of neurons as in panel B).

