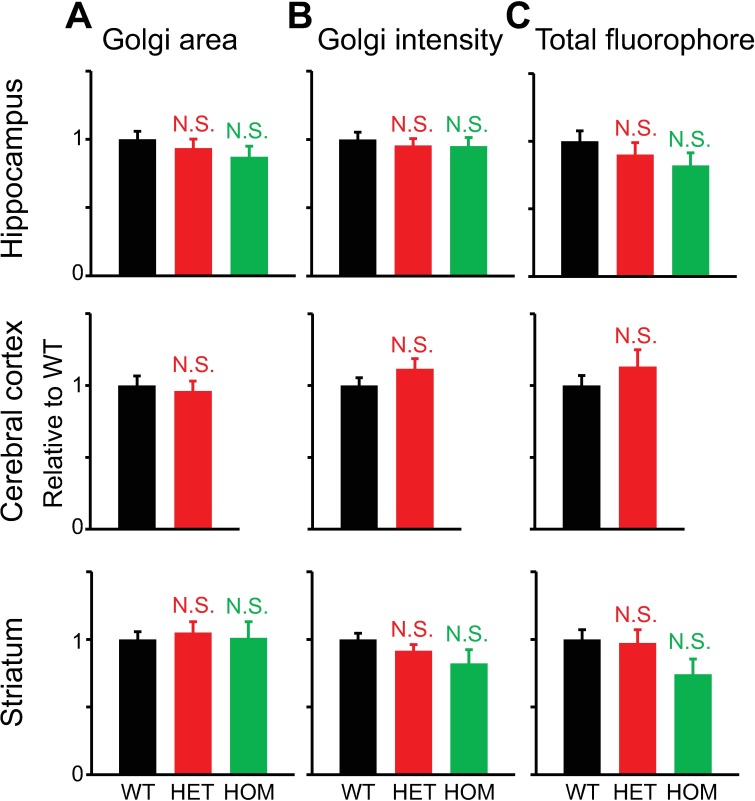
Fig 7. Quantitative analysis of the Golgi structure in ceramide-stained neurons from the hippocampus, cerebral cortex and striatum, as analyzed by the MIP method.
Confocal microscopy was carried out at 17–21 DIV. A: Golgi area. B: Averaged pixel intensity in the Golgi. C: Total amount of fluorophore. All measured values were normalized to average values of WT neurons. Differences in values measured for mutant vs. WT neurons were not statistically significant (p>0.1; t-test; n = 31, 40, 20 hippocampal neurons, 47, 40 cerebral cortical neurons, and 40, 45, 30 striatal neurons for WT, HET and HOM, respectively).

