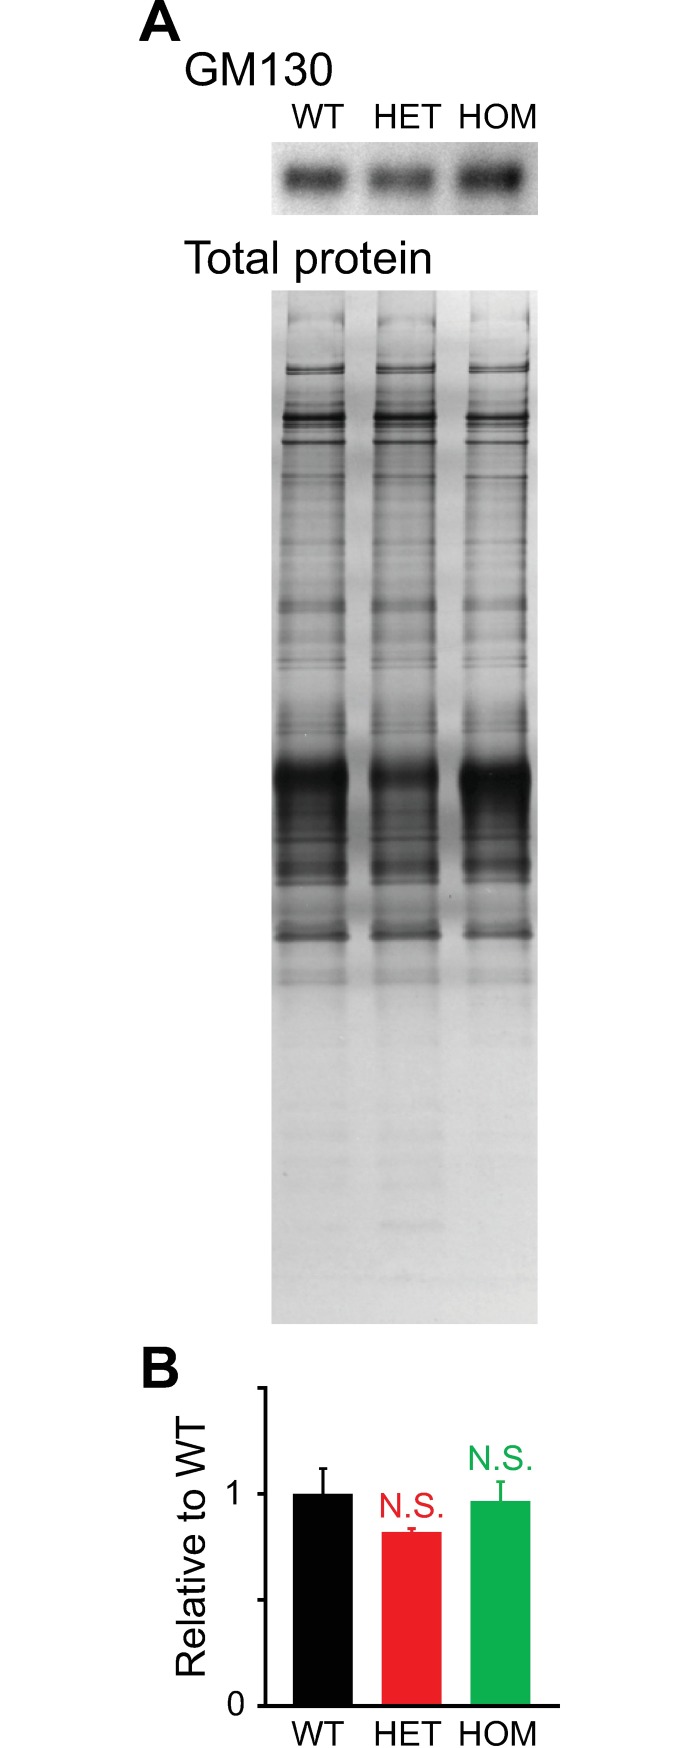
Fig 14. Expression of the Golgi protein GM130 in cultured cells as assessed by Western blotting.
Cultured hippocampal cells were processed for Western blotting at 17 DIV. A: GM130 immunoblot, with total protein used as a loading control. B: Bar graph of GM130 levels following normalization to the average WT value. Differences in expression between mutant vs. WT cultures were not statistically significant (p>0.1; t-test; n = 3 per genotype).

