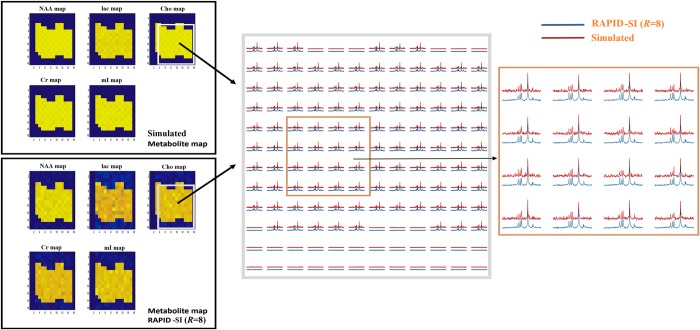
Fig 5. Reconstruction results of simulated data.
2D simulated (with simulation parameters of SNR = 6 and ΔB0 map B2) (top left) and reconstructed RAPID-SI (R = 8) (bottom left) metabolite maps after pre-processing. Spectra from the zoomed 12x12 matrix (white box) and the central 4x4 matrix (brown box) are displayed.

