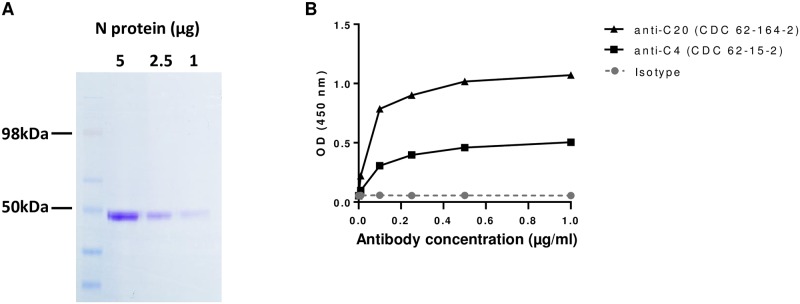
Fig 2. N protein expression purity and confirmation of native epitopes.
(A) Recombinant N protein was separated on SDS-PAGE gel at indicated concentration and stained with Coomassie stain for visualization of all proteins in the N protein preparation. Protein ladder indicates estimated size of protein bands. (B) OD absorbance value of N protein detected with primary mAbs against N protein conformation epitopes at different antibody concentrations in an ELISA format. Mouse IgG isotype was used a control. Secondary antibody against mouse IgG conjugated with HRP was used.

