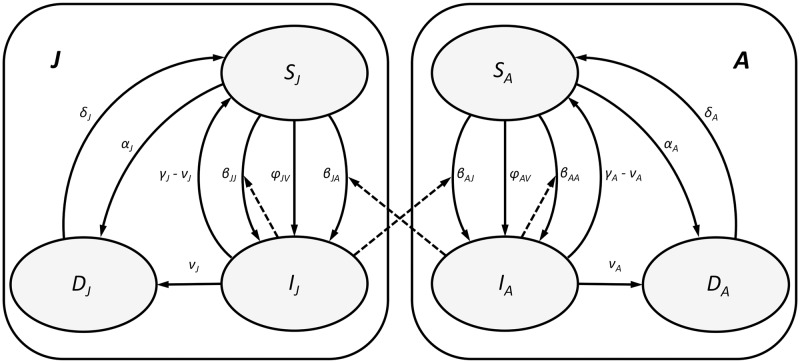
Fig 2. The graphical representation of the SID model from Table 2 with marked two compartments J (juveniles) and A (adults).
Solid lines denote transitions within compartments. Dashed lines indicate transitions due to interactions (both within and across compartments) between susceptible (S) and infected (I) individuals.

