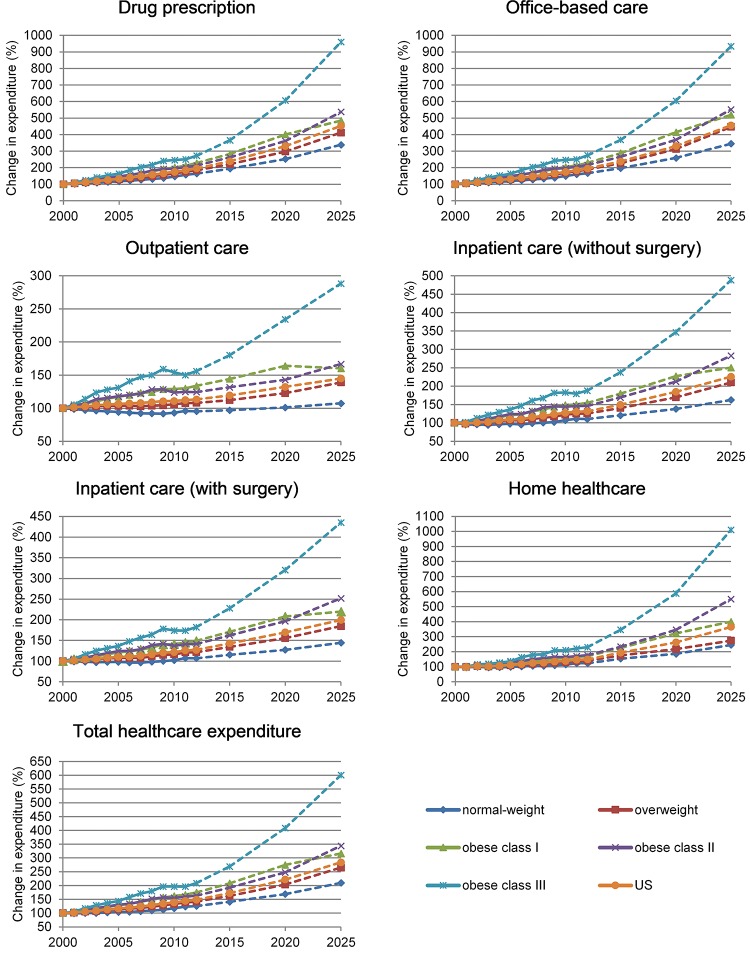
Fig 2. Change in healthcare expenditure (%) by category of service and BMI; US population 2000–2025.
Note: continuous lines represent historical trends; dotted lines represent projections; BMI (Body Mass Index) categories are defined according to WHO thresholds (WHO 2016) for adults and Cole et al. 2000 for children and teenagers; 2000 is base year equal to 100; additional results in the S2 Fig.

