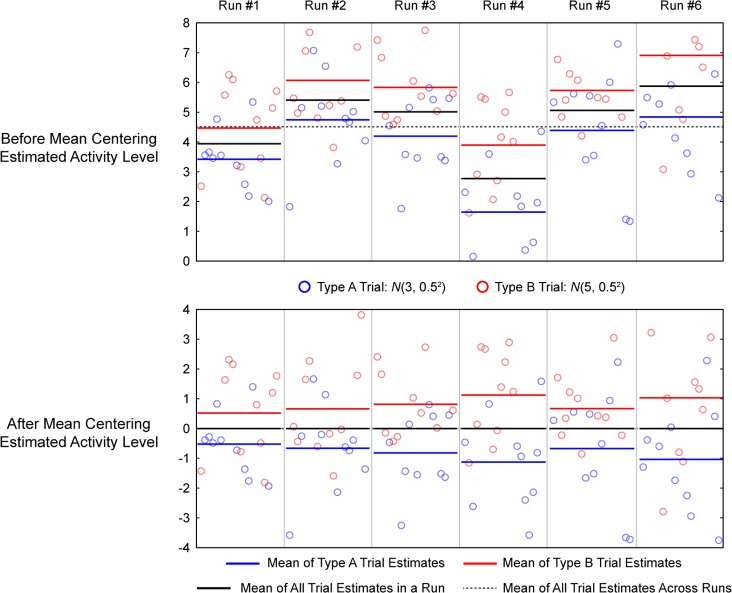
Fig 1. Effect of mean centering on simulated data.
6 runs of data was simulated with ISI drawn from U(0, 4), and noise std. = 0.8. Single trial estimates were performed with LS-S procedure. Top panels plot the estimated activity levels of each trial for each run. Two trial types are color-coded and their respective run-level means are also shown in color-coded bars to show spurious mean shifts. The horizontal dotted line marks the experiment-wise mean across runs. The bottom panels plot the same data but with run-level mean centering, which essentially subtracts the mean of all trial estimates in a run (shown in black bar) from all the trial estimates within the said run.

