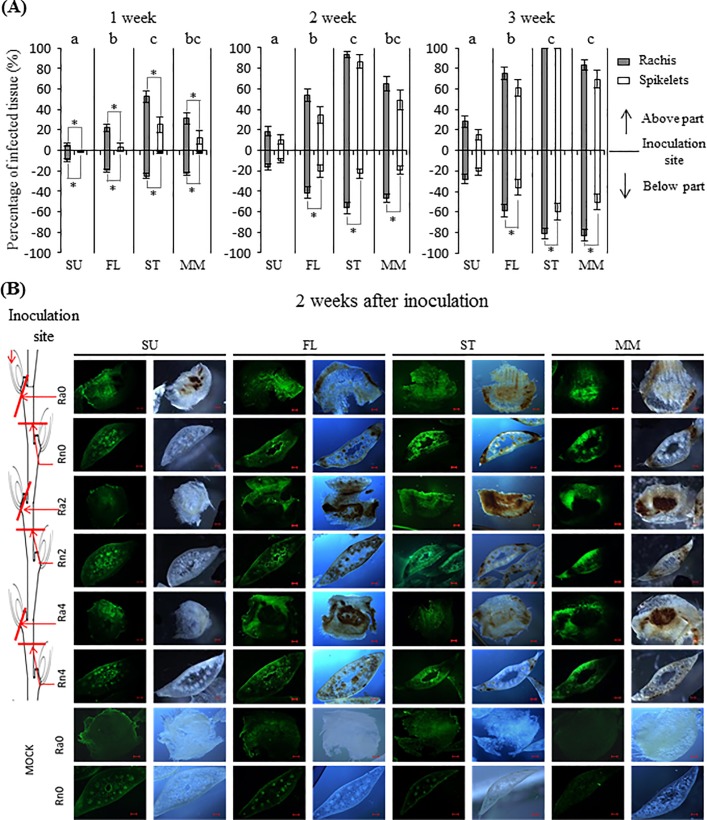
Fig 1. Disease assessment of four wheat varieties.
(A) Macroscopic disease symptoms are indicated as the percentage of bleached or brown rachis internodes (grey bar) and spikelets (white bar) above or below the inoculation site over a three-week period. Values represent means ± standard error. For each variety, the Student’s t test was performed between the percentage of infected rachis internodes and spikelets. * indicates P < 0.05. Among the four varieties, a one-way ANOVA of data based on infected rachis internodes was performed at each time point at α = 0.05 to determine significance. Histograms with different letters are statistically different. SU, Sumai3; FL, FL62R1; ST, Stettler; MM, Muchmore. (B) Microscopic observation of the F. graminearum infection process in the rachis of the four varieties at 2 wpi. The cross-section of rachis internodes and rachillas below the inoculated site were dissected individually and stained with Wheat Germ Agglutinin (WGA). Each sample was photographed separately under fluorescence and light microscope. The scale bar indicates 200 μm. A schematic illustration of a wheat spike is shown on the left-hand side. Red lines indicate the approximate position of hand cross sections in sequential rachises. Each row of photographs represents the same cross section level of each of the four varieties. For the mock treatment, only the adjacent rachilla (Ra0) and rachis internode (Rn0) of mock-treated spikelet were examined and shown in the bottom two rows. Ra, Rachilla; Rn, Rachis internode.

