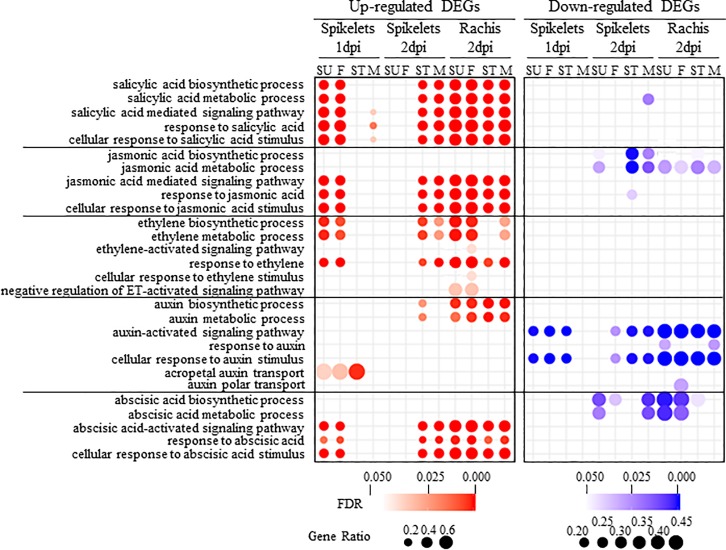
Fig 4. Gene Ontology (GO) enrichment analysis for phytohormone related pathways.
Gene ratio equals the number of differentially expressed genes against the number of genes associated with a GO term in wheat genome. The Fisher test was performed to indicate the significance of GO enrichment (FDR < 0.05).

