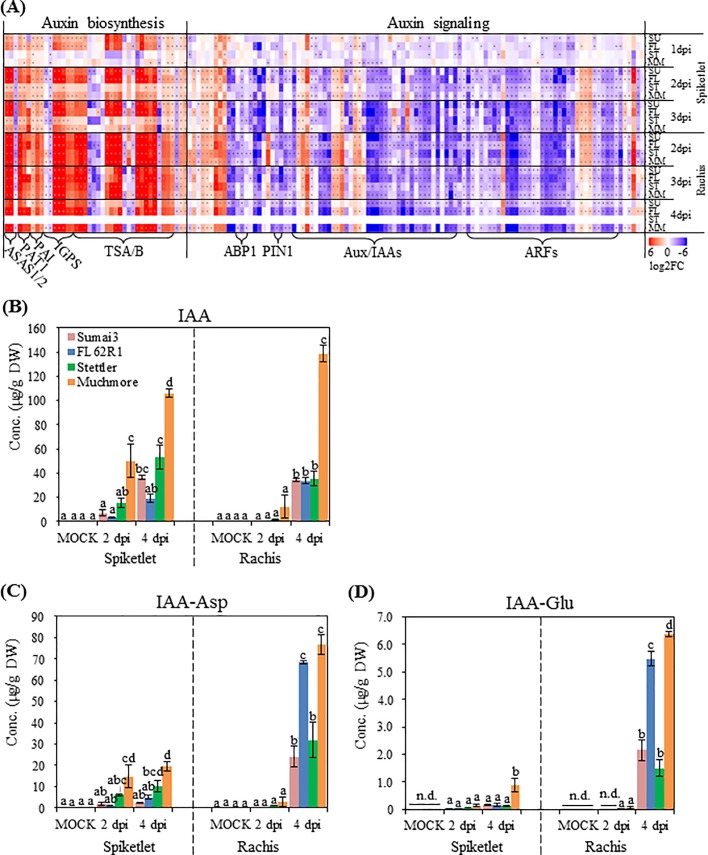
Fig 6. Hormone and transcriptome profiling of auxin (IAA) and two of its amino acid conjugates.
(A) extent of differential expression patterns after F. graminearum infection (Log2 fold change). Asterisks (*) denote significant (p ≤ 0.01). A full list of DEGs is provided in S7 Dataset. (B) IAA, (C) IAA-Asp and (D) IAA-Glu contents in the spikelet and rachis. Values = means ± standard error (n = 3). In each organ, a two-way ANOVA of data was performed at α = 0.05 to determine significance. Histograms with different letters are statistically different.

