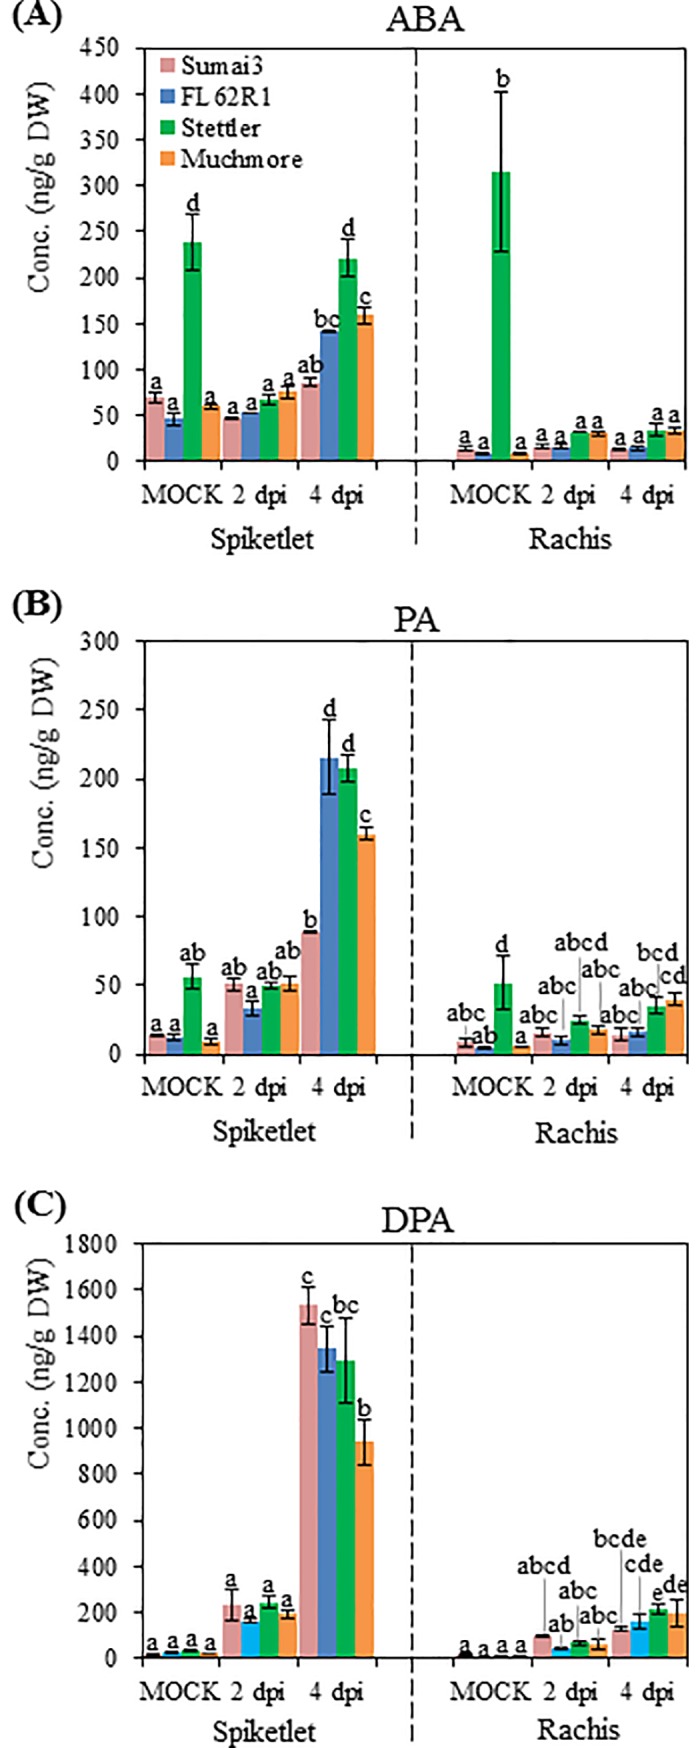
Fig 7. Contents of ABA and its metabolites after F. graminearum inoculation.

ABA (A), PA (B) and DPA (C) contents in the spikelet and rachis. Values = means ± standard error (n = 3). In each organ, a two-way ANOVA of data was performed at α = 0.05 to determine significance. Histograms with different letters are statistically different.
