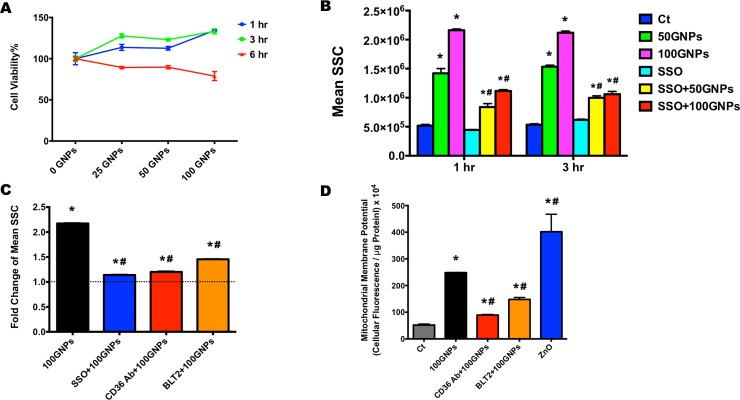
Fig 3. Cell viability, cellular uptake, and mitochondrial membrane potential changes following exposure to GNPs.
(A). Cell viability percentages of macrophages following the exposure to 0, 25, 50, or 100 μg/mL GNPs for 1, 3, or 6 hr. Data represent mean ± SEM, n = 6/group. *: p < 0.05, as compared with the control group. (B). Cellular uptake of GNPs following the exposure to 50 or 100 μg/mL GNPs for 1 or 3 hr with or without the 1 hr-pretreatment of 100 μM SSO by side scatter (SSC) using flow cytometry. Data represent mean ± SEM, n = 6/group. *: p < 0.05, as compared with the control group; #: p < 0.05, as compared with the 50 μg/mL GNPs group. (C). SSC fold change of macrophages following the exposure to 100 μg/mL GNPs for 2 hr with or without the 1 hr-pretreatment of 100 μM SSO, CD36 antibody, or 100 μM BLT2. Data represent mean ± SEM, n = 6/group. *: p < 0.05, as compared with the control group; #: p < 0.05, as compared with the 100 μg/mL GNPs group. (D). Intracellular Rhodamine 123 (R123) accumulation in macrophages exposed to 0 or 100 μg/mL GNPs with or without the 1 hr-pretreatment of CD36 antibody or 100 μM BLT2. Macrophages exposed to 100 μg/mL ZnO NPs were used as positive control. Data represent mean ± SEM, n = 6/group. *: p < 0.05, as compared with the control group; #: p < 0.05, as compared with the 100 μg/mL GNPs group.

