
Fig 4. Venn diagram of dose-response metabolite changes between the comparisons of 50GNPs vs. control and 100 GNPs vs. control.
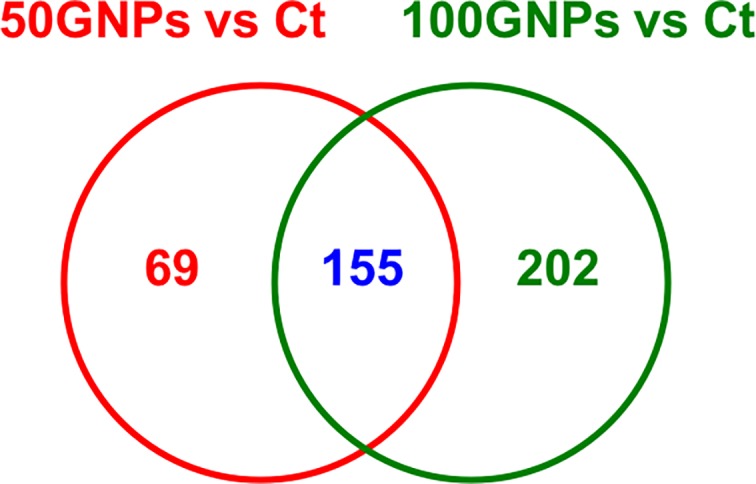
Macrophages were exposed to 0 (control), 50, or 100 μg/mL GNPs for 1h followed by metabolomics analysis. Identified metabolites with fold changes greater than 2 and p value less than 0.01 are included within the diagram.