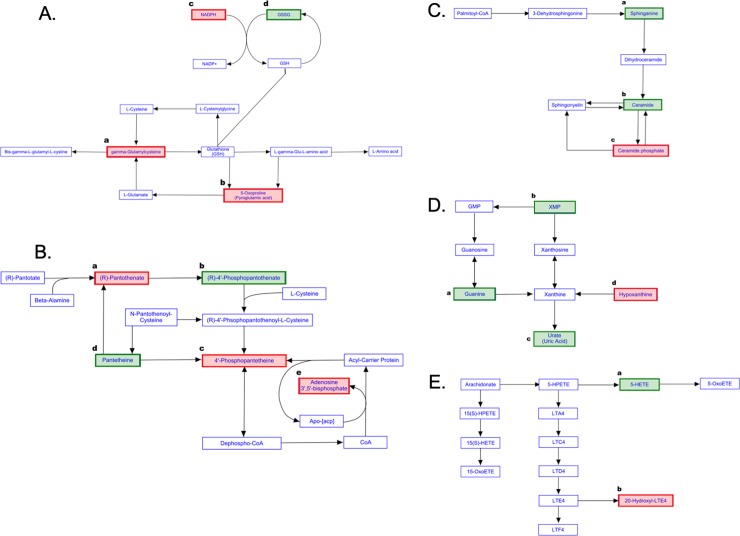
Fig 5. Metabolism pathways influenced following GNPs exposure.
(A) Glutathione metabolism pathway: (a) gamma-glutamylcysteine (γ-Glu-Cys), (b) 5-Oxoproline, and (c) NADPH highlighted with red rectangular boxes were up-regulated following exposure to 50 or 100 μg/mL GNPs for 1h. In addition, γ-Glu-Cys was also increased following the exposure to 50 μg/mL GNPs for 3h. (d) GSSG (oxidized glutathione) highlighted with green rectangular box was significantly down-regulated following 1h-treatment with the CD36 ligand (100 μM SSO). (B) Pantothenate and CoA biosynthesis pathway: (a) (R)-Pantothenate (also named pantothenic acid) highlighted with the red rectangular box was the statistically up-regulated metabolite in both 50 and 100 μg/mL GNP-exposed macrophages for both 1h and 3h time points, as well as the 100 μM SSO-treated macrophages. (b) (R)-4’-Phosphopantothenate (also named D-4’-Phosphopantothenate) highlighted with the green rectangular box was the statistically reduced metabolite in all treatment groups. (c) 4’-Phosphopantetheine (also named D-Pantetheine 4'-phosphate) highlighted with the red rectangular box was the markedly up-regulated metabolite following the 3h-exposure to 50 μg/mL GNPs. (d) Pantetheine highlighted with the green rectangular box was the significantly down-regulated metabolite in all treatment groups except the group with 3h exposure to 50 μg/mL GNPs. (e) Adenosine 3’,5’-bisphosphate (PAP) highlighted with the red rectangular box was the significantly increased metabolite in both 50 and 100 μg/mL GNPs-exposed macrophages for both 1h and 3h time points. (C) Sphingolipid metabolism pathway: (a) Sphinganine highlighted with the green rectangular box was the significantly down-regulated metabolite in macrophages exposed to 100 μM SSO. (b) Ceramide (also named C16 Sphinganine) highlighted with the green rectangular box was the statistically reduced metabolite in macrophages exposed to 100 μg/mL GNPs. (c) Ceramide phosphate (also named CerP (d18:0/16:0)) highlighted with red rectangular box was the markedly up-regulated metabolites in 100 μg/mL GNPs-exposed macrophages. (D) Purine metabolism pathway: (a) Guanine highlighted in the green rectangular box was the significantly down-regulated metabolite in macrophages exposed to 50 or 100 μg/mL GNPs for 1h, as well as 100 μM SSO. (b) Xanthosine monophosphate (XMP) highlighted with the green rectangular box was the metabolite found to be down-regulated in macrophages pretreated with 100 μM SSO. (c) Urate (also named Uric acid) highlighted in the green rectangular box was the statistically reduced metabolite in macrophages exposed to 50 or 100 μg/mL GNPs for 1h. (d) Hypoxanthine highlighted with the red rectangular box was the markedly up-regulated metabolite in macrophages exposed 100 μg/mL GNPs for 1h and 50 μg/mL GNPs for 3h. (E) Arachidonic acid metabolism pathway: (a) 5-HETE (also named 5S-HETE-d8) highlighted with the green rectangular box was the statistically down-regulated metabolite in both 50 and 100 μg/mL GNP-exposed macrophages for both 1h and 3h time points. (b) 20-Hydroxyl-LTE4 highlighted with the red rectangular box was the statistically up-regulated metabolite in both 50 and 100 μg/mL GNP-exposed macrophages for both 1h and 3h time points.

