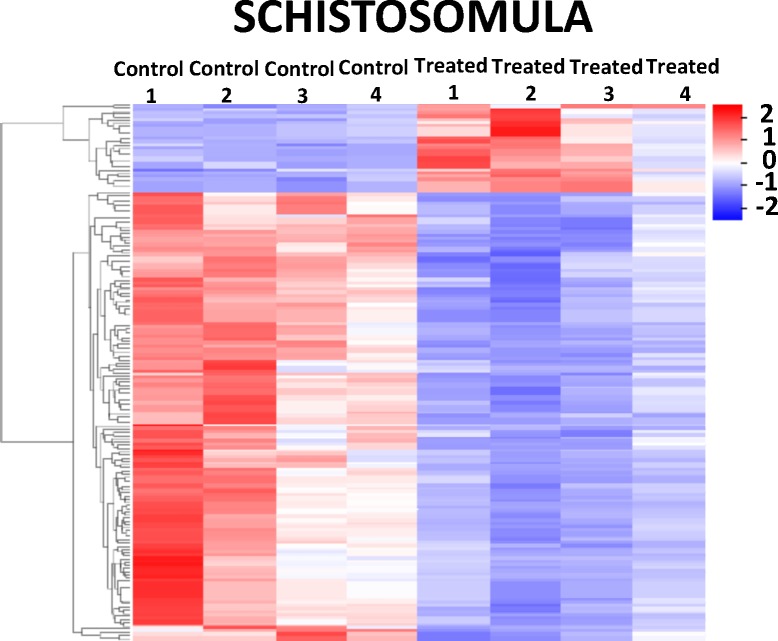
Fig 9. Heatmap of differentially expressed genes detected by RNA-seq in schistosomula treated with GSK343.
The heatmap shows the hierarchical clustering of differentially expressed genes (lines) in four biological replicates (columns) of schistosomula samples, either for controls or for treated parasites, as indicated at the top of the heatmap. Parasites were exposed for 48 h in vitro to vehicle (control) or to 20 μM GSK343. Gene expression levels were measured by RNA-seq and are shown as Z-scores, which are the number of standard deviations below (blue, downregulated) or above (red, upregulated) the mean expression value among treated and control samples for each gene; the expression level Z-scores are color-coded as indicated on the scale at the bottom.

