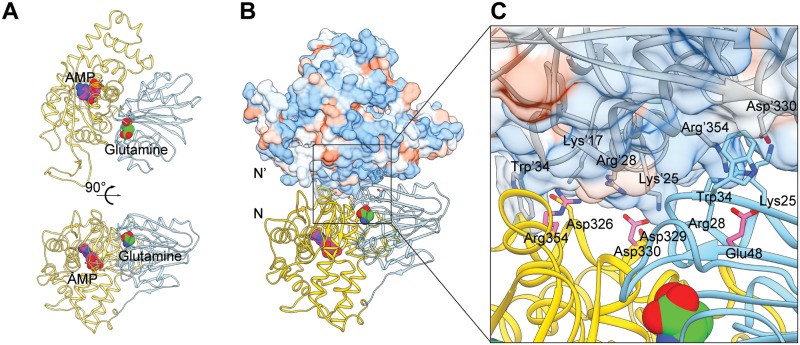
Fig 7. Homology model of Asn1 and its dimer.
(A) Homology model of Asn1 monomer using E.coil ASNB as reference. N-terminal domain containing the glutamine binding site and C-terminal domain containing the AMP binding site are shown in cyan and yellow, respectively. Glutamine is shown in green and AMP in magenta. (B) Homology model of Asn1 dimer. N-N’ presents Asn1 dimer interface. N’ is shown as hydrophobicity surface view. Blue represents the hydrophilic surface area and orange represents the hydrophobic surface area. (C) Asn1 dimer interface. Key residues in protein are labelled and mutation sites may have a strong effect on dimerization of Asn1 are highlighted with pink (D330, R354, E48).

