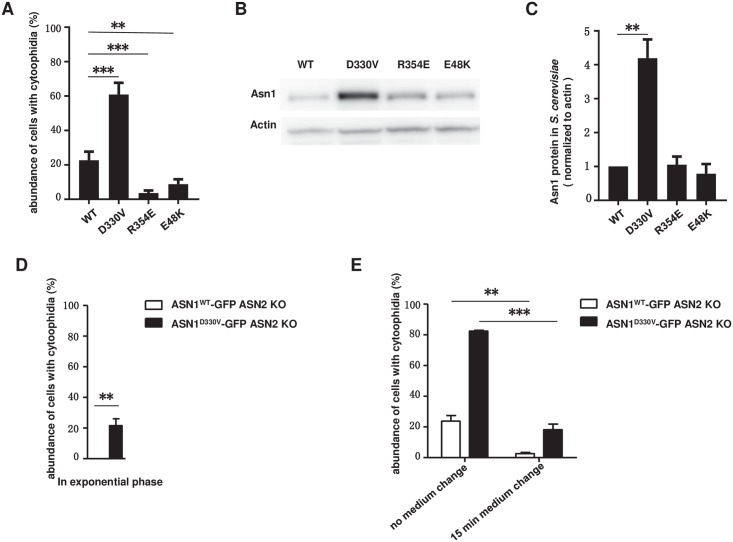
Fig 9. Asn1 cytoophidium abundance and relative protein levels are altered in D330V mutant.
(A) The proportion of cells with Asn1 cytoophidia in different dimer interface mutants. **P<0.001. ***P<0.0001. Error bars show SEM. B) Western blot analysis of Asn1 relative protein levels. (C) Fold change of Asn1 protein level in all mutants. **P<0.001. Error bars show SEM. (D) Quantification of cytoophidium abundance of ASN1WT-GFP ASN2 KO cells and ASN1D330V-GFP ASN2 KO cells in exponential phase. **P<0.001. Error bars show SEM. (E) Effect of 15 min medium change on ASN1WT-GFP ASN2 KO cells and ASN1D330V-GFP ASN2 KO cells. **P<0.001. ***P<0.0001. Error bars show SEM.

