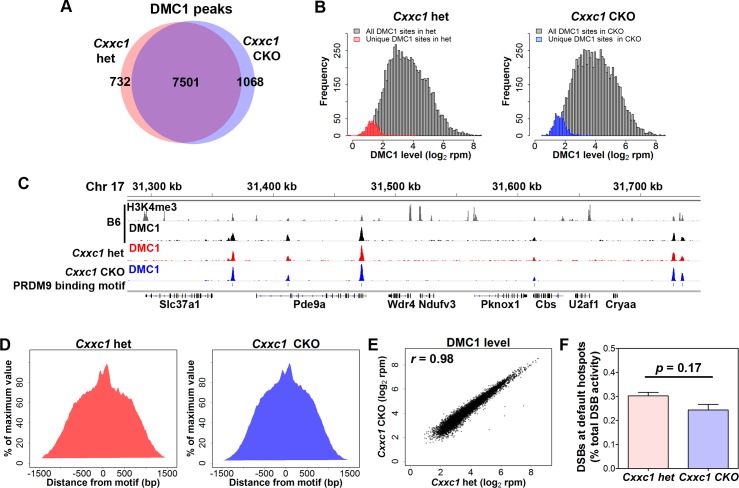
Fig 6. DSB occur at PRDM9 dependent sites in Cxxc1 CKO.
ChIP-seq data determining the number and positioning of DSB sites in CKO and heterozygous controls. (A) Venn diagram of DMC1 peak number in Cxxc1 het and CKO. 7,501 peaks are shared in Cxxc1 het and CKO. (B) Frequency distribution plot of DMC1 activity in Cxxc1 het (left panel) and CKO (right panel). All DMC1 peaks (n = 7,501) were shown in grey in both panels; unique peaks in het controls (n = 732) were shown in red; unique peaks in CKO samples (n = 1,068) were shown in blue. (C) Coverage profiles of published B6 H3K4me3 (grey), B6 DMC1 (black), Cxxc1 het DMC1 (red) and CKO DMC1 (blue) from a representative region on chromosome 17. PRDM9 binding motif sites are shown in line 5. (D) Aggregation plot of DMC1 signal in het control (left) and CKO (right). The signal was normalized to the maximum signal. (E) Plot of activity of DSBs from Cxxc1 CKO and control spermatocytes. Correlation coefficient r = 0.98. (F) Percentage of DMC1 activity in default sites contributes to total activity.

