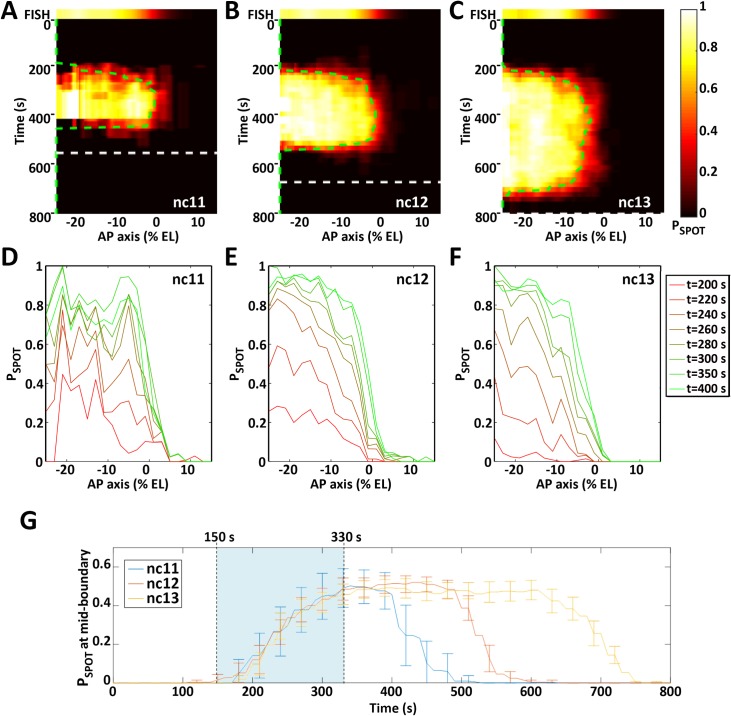
Fig 7. The dynamics of hb-MS2ΔZelda expression pattern.
A-C: The probability for a given locus to be ON (PSPOT(t)) is indicated by a heat map (color scale on the right where PSPOT(t) = 0 is black and PSPOT(t) = 1 is white) horizontally as a function of position along the AP axis (0% EL positioned where PON = 0.5 at nc12) and vertically as a function of time (s) fixing the origin at the onset of interphase for each nucleus (see details in S2 Text and S4 Fig). The top panel shows the endogenous hb expression pattern as measured from RNA FISH (15). For each cycle (A: nc11; B: nc12; C: nc13), the end of interphase (onset of the next mitosis) is indicated by a dashed line (white). The green dashed line indicates the position of the expression boundary (PSPOT(t) = 0.5) over time. D-F: PSPOT(t) as a function of position along the AP axis for different times during the interphase of nc11 (D), nc12 (E) and nc13 (F). G: PSPOT(t) as a function of time (s) at the mid-boundary position (where PSPOT(t) reaches a steady value of 0.5). The first hints of transcription are observed at the mid-boundary position ~ 150 s after the onset of the interphase (lower limit of the light blue zone) and steady state is reached at ~ 330 s (higher limit of the light blue zone). The boundary formation reaches steady state in ~ 180 s. Data were obtained from 5 (nc11), 8 (nc12) and 4 (nc13) embryos. Embryos were aligned spatially by fixing the origin of the axis (0% EL) at the boundary position (PON = 0.5) at nc12 and the origin of time was calculated for each nuclei as the origin of the respective nuclear cycle (see S2 Text and S4 Fig).

