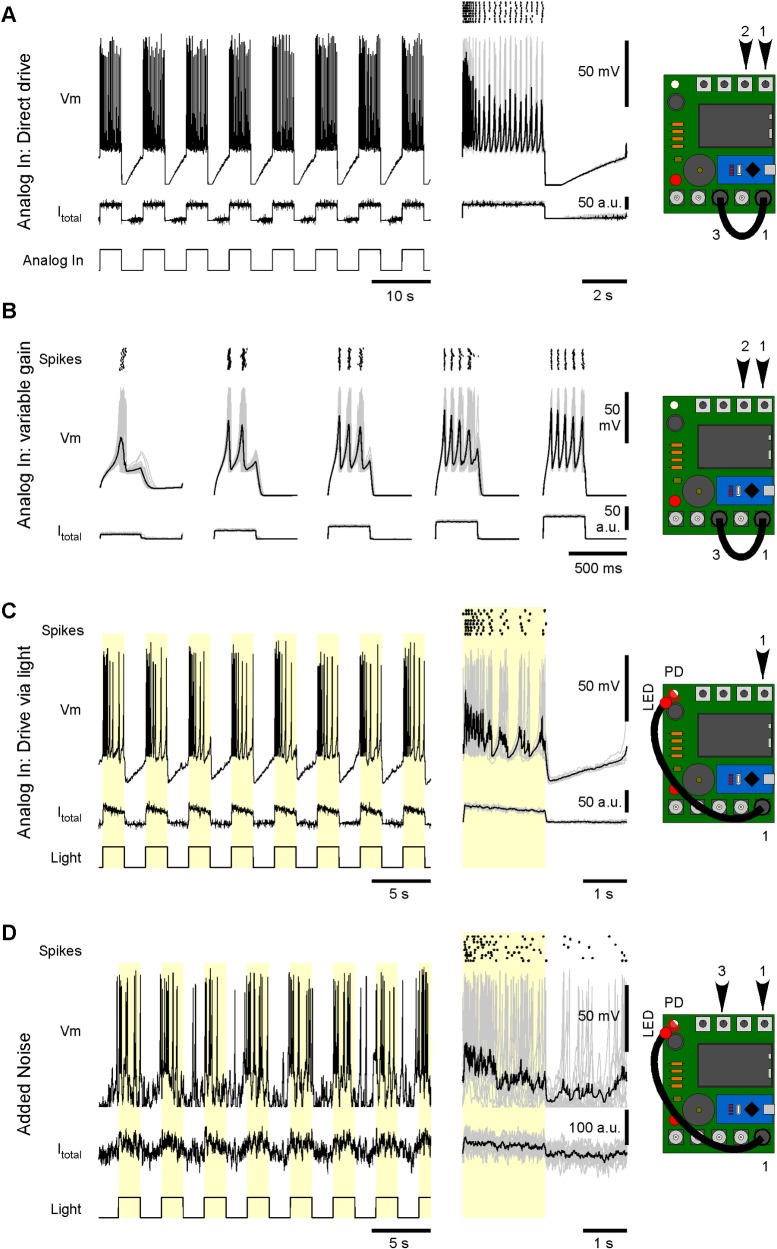
Fig 3. Basic stimulus-driven functions.
A. Example recording of Spikeling in mode 1 driven by the internal stimulator (port 1) via the analog-in connector (port 3), as indicated. Gain and stimulus rate are controlled on dials 2 and 1, respectively. Right: stimulus aligned response segments (grey) and average (black) as well as spike raster plot. B. As (A, right), with varying input gain to probe amplitude tuning. Note systematic effects on spike number, rate, time latency, and time precision. C. As (A), but this time driving Spikeling via an LED attached to the stimulus port stimulating the photodiode. Note different waveforms of input current and consequences on the elicited spike pattern compared to (A). D. As (C), with addition of current noise (dial 3). Note distortion of spike timings, while the number of spikes triggered remains approximately constant. LED, light-emitting diode.

