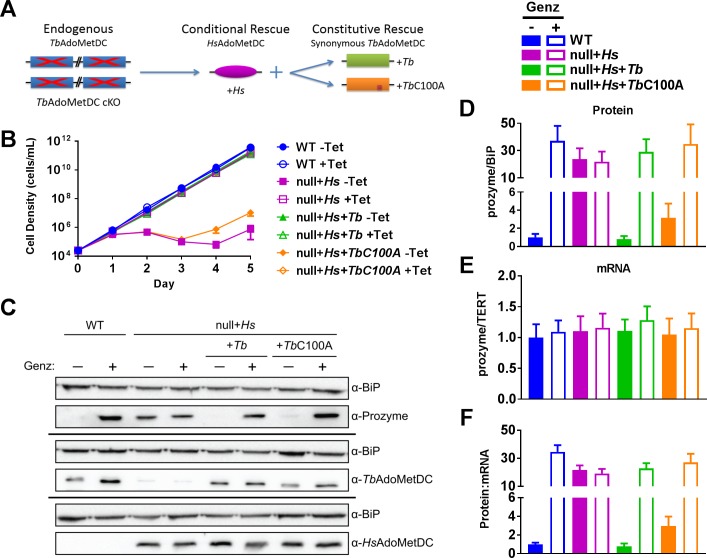
Fig 3. TbAdoMetDC is a negative regulator of prozyme expression.
(A) Schematic representation of TbAdoMetDC knockout and complementation strategies. (B) T. brucei growth analysis of WT SM, TbAdoMetDC null+Hs, TbAdoMetDC null+Hs+Tb, TbAdoMetDC null+Hs+TbC100A cell lines ±Tet. Error bars represent SD of three biological replicates. (C) Western blot analysis of WT SM, TbAdoMetDC null+Hs, TbAdoMetDC null+Hs+Tb, TbAdoMetDC null+Hs+TbC100A cell lines ±Genz-644131 (24 h) at the respective EC50 for each parasite cell line (see S2C Fig). (D) Quantitation of prozyme protein levels in Fig 3C normalized to BiP loading control relative to WT –Genz sample. (E) RT-qPCR analysis of prozyme of WT SM, TbAdoMetDC null+Hs, TbAdoMetDC null+Hs+Tb, TbAdoMetDC null+Hs+TbC100A cell lines ±Genz-644131 (24 h). mRNA levels are normalized to TERT expression and the WT–Genz sample. (F) Ratio of prozyme protein levels to mRNA levels from sample samples shown in Fig 3D, 3E, and 3F. Error bars represent SEM of biological replicates, where n = 3 except for null+Hs+TbC100A +Tet, where n = 2.

