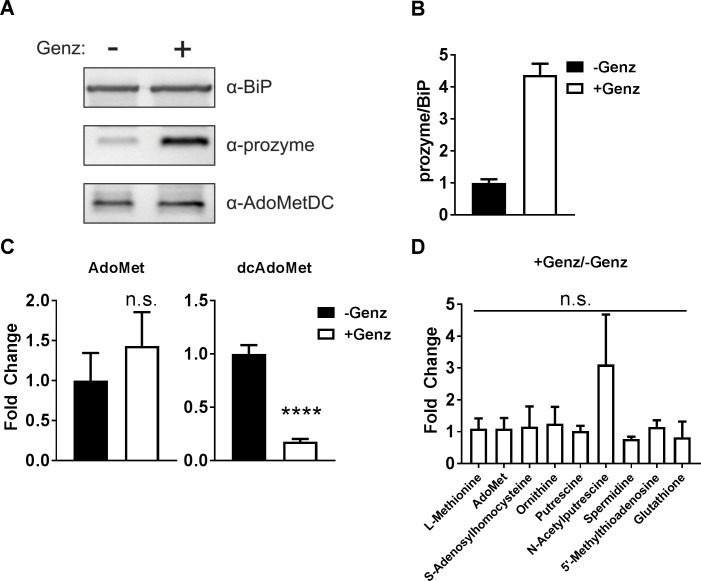
Fig 4. Prozyme protein induction correlates with a depletion of dcAdoMet.
BSF 427 cells were treated ±Genz-644131 (15 nM) for 6 h then harvested for western blot and LC-MS analysis. (A) Western blot analysis of prozyme, TbAdoMetDC and TbBiP. (B) Quantitation of prozyme protein levels from Fig 4A, normalized to TbBiP relative to –Genz. (C) AdoMet (left panel) and dcAdoMet (right panel) metabolite levels measured by LC-MS normalized to total protein determined by BCA Assay relative to –Genz. (D) Fold change of selected polyamine pathway metabolites measured by LC-MS normalized to –Genz. Measurements shown in Fig 4B and 4C were taken from the same samples but were performed by separated methods. For Fig 4B, 4C and 4D, error bars represent SEM of three biological replicates where n = 3. For C and D, significance was determined by multiple T test analysis in GraphPad Prism comparing +Genz and –Genz. **** P<0.0001.

