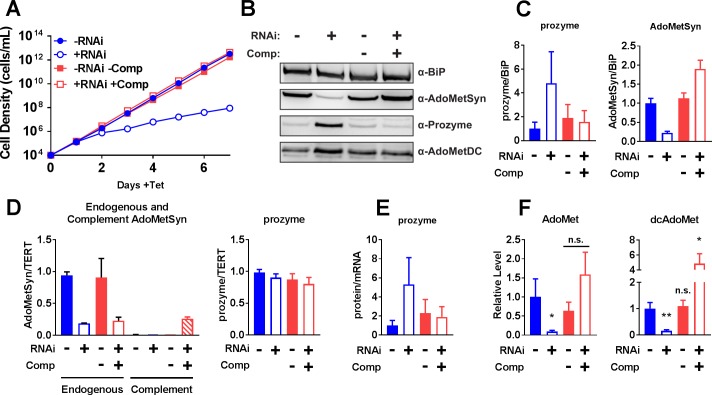
Fig 5. TbAdoMetSyn knockdown upregulates prozyme expression.
(A) Growth analysis of TbAdoMetSyn-RNAi (Blue) and TbAdoMetSyn-RNAi+Comp (Red) cell lines ±Tet. Error bars represent SD of three biological replicates, but error bars are smaller than symbols. (B) Western blot analysis of TbAdoMetSyn, prozyme, AdoMetDC and TbBiP ±Tet (48 h). Error bars represent SD for three biological replicates. (C) Quantitation of western blots from Fig 5B prozyme (left panel) and TbAdoMetSyn (right panel) protein levels normalized to TbBiP relative to TbAdoMetSyn-RNAi –Tet B. (D) RT-qPCR analysis of TbAdoMetSyn (left panel) and prozyme (right panel) mRNA levels normalized to TERT expression ±Tet (48 h). Endogenous (solid) and complement (striped) TbAdoMetSyn were normalized to endogenous TbAdoMetSyn-RNAi –Tet. Prozyme was normalized to RNAi –Tet. (E) Prozyme protein:mRNA ratio from Fig 5C and 5D. (F) AdoMet (left panel) and dcAdoMet (right panel) metabolite levels ±Tet (48 h) measured by LC-MS/MS relative to TbAdoMetSyn-RNAi –Tet (Blue, filled). For Fig 5C, 5D, 5E and 5F, error bars represent SEM of three biological replicates, n = 3. For F, significance was determined by multiple T test analysis in GraphPad Prism comparing samples to TbAdoMetSyn-RNAi –Tet. * P<0.05, **P<0.01.

